Crop Insurance Options for Specialty, Diversified, and Organic Farmers
By Jeff Schahczenski, NCAT Agricultural Economist
Abstract
This publication reviews federally subsidized crop insurance, with special attention to options available to specialty, diversified, and organic farmers. Generally, the greater the diversity or specialization of the crops and livestock that farmers produce, the more difficult it can be to obtain insurance that fully covers the value and risks of their production. This publication gives several examples of using alternative crop-insurance policies that can offer some degree of protection from significant market-price changes and the multiple perils of farming that can impact yield. It gives special attention to Whole-Farm Revenue Protection (WFRP) insurance, which may be of interest to growers of diverse specialty and organic crops and livestock.
Insurance Terms Defined
Premium: the cost of insurance over a specific period of time.
Premium subsidy: amount of the premium paid by the federal government on the insured’s behalf.
Coverage level: percentage of the insured value covered by the insurance policy.
Indemnity: payment made to the insured in the event of an insured loss.
Price election: predetermined prices of insured crop used in calculating premiums and indemnities.
Introduction
The Basics
Farming is a risky business, and federally subsidized crop insurance can help minimize that risk. However, crop insurance products are not always available for all the crops or livestock you might produce in your location. Also, adequate crop insurance for organic production—a kind of specialty in itself—while increasing in availability, is still limited to only certain crops and counties in the United States. However, before discussing what insurance options are available, it is useful to understand some basics about federal crop insurance.
First, the U.S. Department of Agriculture’s (USDA) Risk Management Agency (RMA) manages and administers all federally subsidized crop- and livestock-insurance products in the United States. However, the RMA does not sell or service these products; rather, it sets their basic terms, and the federal government hires private companies to actually sell and service the policies that farmers purchase. The RMA, in turn, is governed by the Federal Crop Insurance Corporation (FCIC), which officially approves new kinds of federally subsidized insurance products and any changes to the products already being offered.
Second, “federally subsidized” means that part of the cost of the premium is paid by the federal government. The range of premium subsidies provided to farmers for any one insurance product varies depending on the type of policy. In 2017, farmers received close to $6 billion in premium subsidies (RMA, 2017a). This is a significant public benefit to farmers. Because federal crop-insurance subsidies are calculated as a percentage of the total value of crops insured, public expenditures on subsidies rise and fall along with the value of insured production and as farmers insure more or less of their production. Figure 1 shows the changes in premium payments and subsidies from 1981 to 2014.
What is Insured?
Federal crop-insurance policies can be divided into three categories: major commodity crops, specialty crops, and livestock. Major-commodity crop-insurance policies are available for such crops as corn, soybeans, wheat, rice, and cotton. As can be seen in Figure 1, these five commodity crops represent the bulk of crop-insurance coverage in the United States, accounting for almost 74% of the total liability coverage purchased by farmers in 2016.
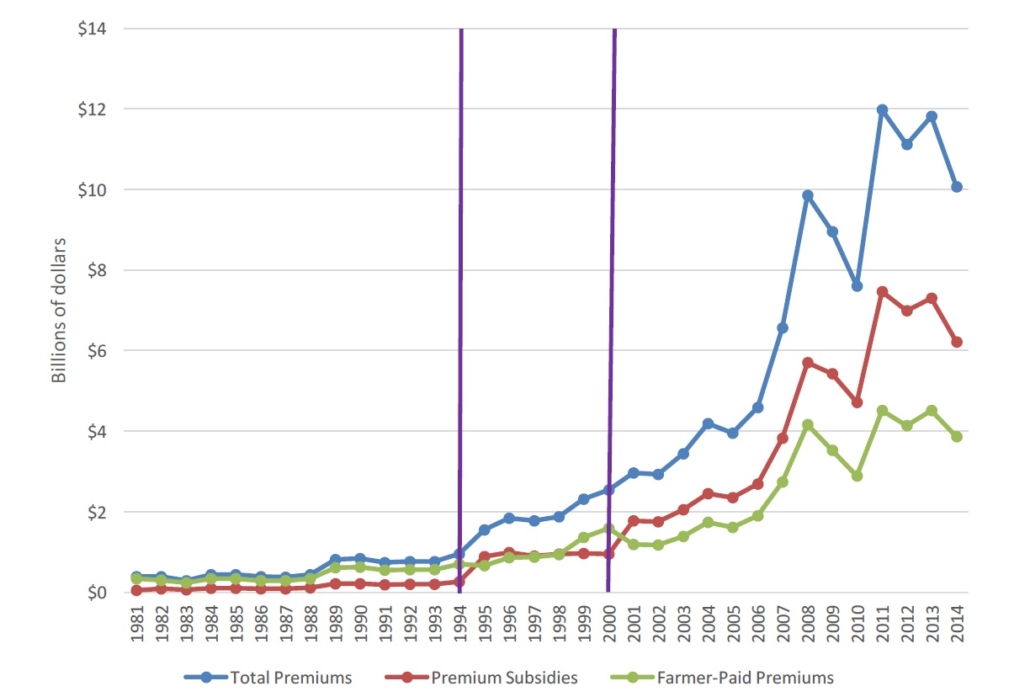
Figure 1. U.S. Crop Insurance Program: Total Premiums, Premium Subsidy Payments, and Farmer-Paid Premiums, 1981-2014 ($ millions) Source: The US Federal Crop Insurance Program: A Case Study in Rent Seeking (Smith, 2017)
Specialty crops, on the other hand, are defined as fruits and vegetables, tree nuts, dried fruits, and horticultural and nursery crops (including flowers). These represent a relatively smaller, but growing, percentage of the total liability coverage of insured crops in the United States.
Finally, federally subsidized insurance for livestock products is a relatively new offering for farmers and ranchers, although these insurance products have been expanding over the last few years. Livestock insurance is currently available for beef cattle, lamb, swine, clams, bees, and milk. Even more recently, novel products have been introduced to assist livestock producers by providing insurance protection for forage production, using national vegetation and rainfall indexes. These index and livestock policies are highly specialized insurance products and are not covered in detail in this publication, although additional sources of information are provided in the Further Resources section.
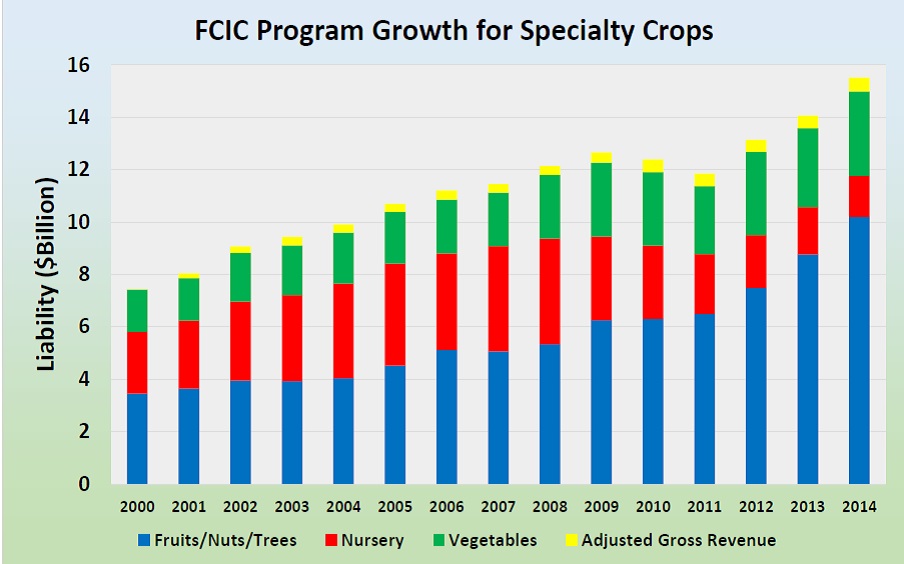
Figure 2. Total Liability Coverage of U.S. Specialty Crops: 2000 to 2014. Source: USDA Risk Management Agency (RMA), 2015
Yield to Revenue Protection
In the late 1930s, the federal government began to support the cost of insurance for farmers because of the devastating impact that the Great Depression had on farmers and ranchers, as well as the yield losses brought about by the dramatic weather and the farming practices related to the Dust Bowl. A secondary reason may have been the early failures of private insurance companies to provide crop insurance to farmers. The failures of these early attempts at purely private insurance products were due in part to both a general lack of good data and poor understanding of the causes of crop-loss variability necessary to properly assess insurable agricultural-production risks (Goodwin and Smith, 1995).
Two broad sources of financial risks for farmers are yield losses caused by weather, pests, and diseases and the often-high variability of the price of crops and livestock.
In the first case, farmers are exposed to what the RMA calls “multiple perils.” These generally include “weather-related causes of loss and certain other unavoidable perils that result in low yields, poor quality, late planting, replanting, and prevented planting. For most crops, covered perils include drought, excess moisture, cold and frost, wind, flood, and damage from insects and disease” (RMA, 2011). These perils are viewed as unavoidable losses that impact the yield of the crop. Yield-protection policies were the first type of federally subsidized crop-insurance policies offered to farmers and were mostly for commodity crops such as wheat, corn, and cotton. Over time, the level of federal subsidization of crop-yield-based insurance, as well as the number of crops covered, expanded greatly. There were 551 crop, crop-type (e.g., food-grade soybeans) and crop-practice (e.g., irrigated corn) policies available to farmers in 2017—a 70% increase from 2000 (RMA, 2017a).
The second major source of risk that farmers face is changing prices of the products they sell. Farmers, unlike many of us, don’t receive a weekly or monthly paycheck, and their ultimate payday depends on a future price for their product that is unknowable and uncontrollable at the time of planting. This price risk was a motivation for the creation of the second major type of federally subsidized crop insurance, broadly called revenue insurance. Although revenue is, strictly speaking, the product of price and yield, farmers’ interest in crop-revenue insurance comes from the protection it provides against the potential of downward changes in the price of crops. It also is important to note that, with a very few exceptions, crop-based revenue insurance is primarily available to a limited number of mostly major-commodity crops. The one minor exception is a geographically limited insurance product called Actual Revenue History (ARH).
The major exception to crop-based revenue insurance, which will be discussed in detail later, is Whole-Farm Revenue Protection (WFRP). WFRP is a unique product in that it insures all the commodities on a farm based on the adjusted gross revenue of the farm and not any specific crop or livestock product. It is also the first crop-revenue insurance product to be available nationwide.
What Yield and What Price?
Federally subsidized crop-insurance policies also vary by how the insurable yield- or price-loss coverage is calculated. Basically, there are five ways. First, the most common yield-insurance policies are called “Actual Production History” or APH policies. The insurable yield-loss coverage is calculated based on the individual farm’s actual historic yield of a crop and a price, called a “price election,” that is determined by the RMA. A variation of APH is called “Yield” insurance. It differs from APH only in that it is limited to a unique set of commodity crops, and the prices used to determine the level of coverage are based on “special commodity-exchange price provisions.” These are prices determined from major commodity and commodity-future exchanges, such as the Chicago Board of Trade.
A second way of determining coverage is based on revenue history. As mentioned earlier, Actual Revenue History (ARH) is based on the historical revenue of an individual farm and either the RMA-determined price election for the crop or, sometimes, the contracted price of the crop. The other variation of revenue insurance is called Revenue Protection (RP), which differs from ARH only in that the coverage also is limited to a special set of commodity crops and that the prices used to determine the level of coverage are based on the same special commodity-exchange price provisions used for yield insurance. There is a version of RP called Revenue Protection with Harvest Price Exclusion (RPHPE), which uses only the initial projected crop price for indemnity calculation, rather than including the harvest price, as does the RP policy. The final variation is Whole-Farm Revenue Protection (WFRP) insurance, which, as discussed earlier, is unique in that it is based on the farm’s gross revenue from all crop and livestock production.
A third way to insure some commodity crops is based on what is referred to as “group risk, “and coverage is based on the historical experience of farms, regarding either yield or revenue of a crop, in an area—usually a county. This kind of policy is called Area Risk Protection Insurance (APRI). Another type of area-based (county) crop-insurance policy is Margin Protection (MP) plans. These plans cover a farm against an unexpected decrease in the operating margin (revenue minus input costs) of producing a crop. These plans are based on county-level average revenue and input-cost data, so they do not necessarily relate to the actual revenue and cost experience of the farm. Margin Protection (MP) plans are limited to specific commodity crops and locations.
A fourth way to determine coverage is called a Dollar plan. This is a type of yield insurance in which the amount of coverage is based on the specific cost of growing a crop in a particular area. Dollar plans are limited to only a very few types of specialty crops in limited locations. In this case, insurance payment is based on the difference between the actual dollar value of the individual farmer’s insured crop and the predetermined or expected dollar value of the crop as determined by RMA.
The final and newest way to estimate coverage, which was briefly mentioned above, is what is referred to as index insurance. Forage, rainfall, and apiculture (honey bee) index insurance policies are currently offered in the United States. These are pilot programs limited to certain states. These products are based on nationally determined average rainfall or forage indexes for a specified area called a “grid.” If the grid rainfall or forage levels were to drop below some pre-determined historical level, the farmer or rancher would be compensated for this “grid loss,” regardless of whether the actual farm or ranch experienced the loss in rainfall or vegetation that occurred generally within the grid. For vegetation index-based policies, a grid is about five square miles; for the rainfall-index-based polices, the grid is about 12 square miles.
Finally, it is important to understand that, despite the complex variations in types of insurance, individual commodity-crop-based revenue insurance is the dominant form of insurance bought in the United States. About 84% of the total liabilities covered by crop-insurance products in 2016 were attributed to individual-crop-revenue policies (RMA, 2017a).
Organic Production and Crop Insurance
Organic farmers generally have seen great improvements in recent years in both the availability and quality of crop-insurance policies. These include the following examples:
- Increases in the number of crops with organic price elections. As of 2017, including the 2018 crop year, organic price elections are available for 79 crops or crop types (different types of tobacco, for instance) (RMA, 2017a). For organic crops, price elections are determined by the RMA from private data sources or are based on a price factor based on conventional prices, which assumes organic crops are higher by some estimated amount.
- The availability of policies based on a contracted price for an insurance guarantee for organic and transitional-organic crops under what is called the Contract Price Addendum (CPA) option. The CPA is capped so the insured contract price is not exactly the actual contract price received. This option is currently limited to 73 crops (RMA, 2016).
- The nationwide availability of Whole-Farm Revenue Protection (WFRP), which, because it is based on the historic revenue of the whole farm (price multiplied by quantity), automatically captures the organic value of both crop and livestock production.
Despite these important improvements, not all organic farmers can take advantage of organic price elections or the Contract Price Addendum option, because both are only available in specific states and counties in the United States. For example, if you wish to purchase crop insurance for fresh-market tomatoes, it is only available in the few counties shown in Figure 3. Furthermore, of these few counties, not all have policies for organic production. The same is true for the Contract Price Addendum option. Thus, although the number of organic crops that can take advantage of crop-insurance policies has increased, availability in a specific location is limited. This limitation is not true of Whole-Farm Revenue Protection, because it is available nationwide for most crops and livestock products.
Specialty-Crop Insurance
Availability and Its Limits for Specialty-Crop Insurance: Apples in Montana
By now it should be obvious that there is no shortage of ways in which at least some crops and livestock can be covered by federally subsidized crop insurance. However, despite the abundance of ways to lower risk with these insurance products, their uncertain availability and other limitations still make it difficult to fully insure every potential crop or livestock product. This is particularly true for organic and specialty crops. For example, there is no crop-insurance coverage for organic apples in Montana.
At one level, there is some sense to such limitations. After all, maybe it is just too risky to grow apples in Montana. Availability also may be limited because of limits on data. All insurance is based on actuarial science, which requires historical data on the yield and price of a crop or livestock product. Despite generally good data on agriculture production and prices in the United States, in some cases there are real data limitations. Thus, if there is no good historical data on organic apple production in Montana or cucumbers in New Jersey, it will be hard to develop an “actuarially sound” yield- or revenue-insurance product for these crops. Finally, some crops may not be considered to be of sufficient economic or organized-producer interest to warrant a federally subsidized insurance product. For instance, there is viticulture (wine grape) production to some degree in almost every state, but not all of this production is of equal economic impact. And, in many cases, there are no organized industry groups to advocate for wine-grape crop insurance in their state or county.
Returning to apples in Montana, however, there is and historically has been apple production in Montana. Some farms do make significant income from growing apples, even if they are produced as part of a diversified operation. Figure 4 is a map of the counties in the United States where insurance for apples is available. Clearly, organic apples in Montana are not on the federal crop insurance radar. However, it is interesting to note where the insurance is available and observe that, even within states, there are availability limitations between counties.
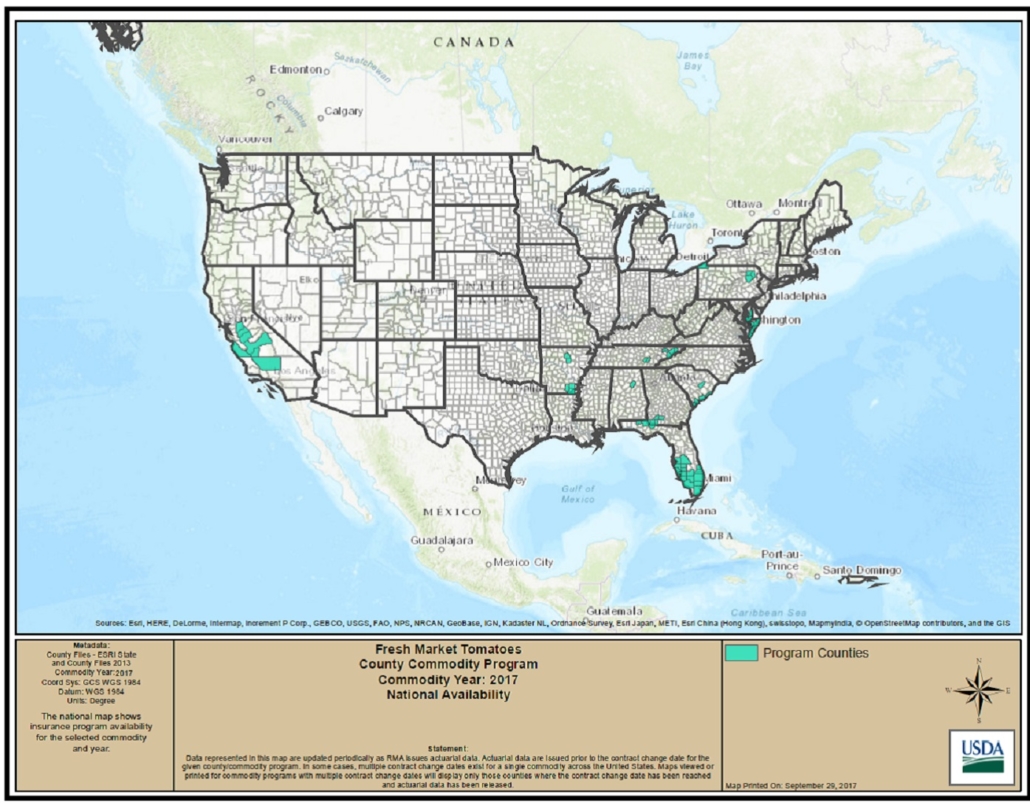
Figure 3: Counties with Fresh-Market Tomato Insurance Policies in 2017. Source: Risk Management Agency (RMA), 2017b.
What this map does demonstrate – and the same is true for most other specialty crops – is that federal crop insurance for apples is largely limited to areas where historical and existing larger-commercial production is concentrated. The same crop-insurance-availability map for field corn, in Figure 5 below, makes this even clearer and provides an interesting contrast. Corn insurance in its many varieties (APH, Revenue, Yield, etc.) is readily available. The point here is not that there may be a corn bias in federally subsidized crop insurance availability. Rather, the maps point out that, even though there are many specialty crops that have some form of federally subsidized crop insurance available, there is no guarantee it will be available to you. That is, unless you happen to live in a county where such production has been historically common or is of significant economic or producer interest. An Internet link to all the maps showing by county where specialty crops are available is provided in the Further Resources section at the end of this publication.
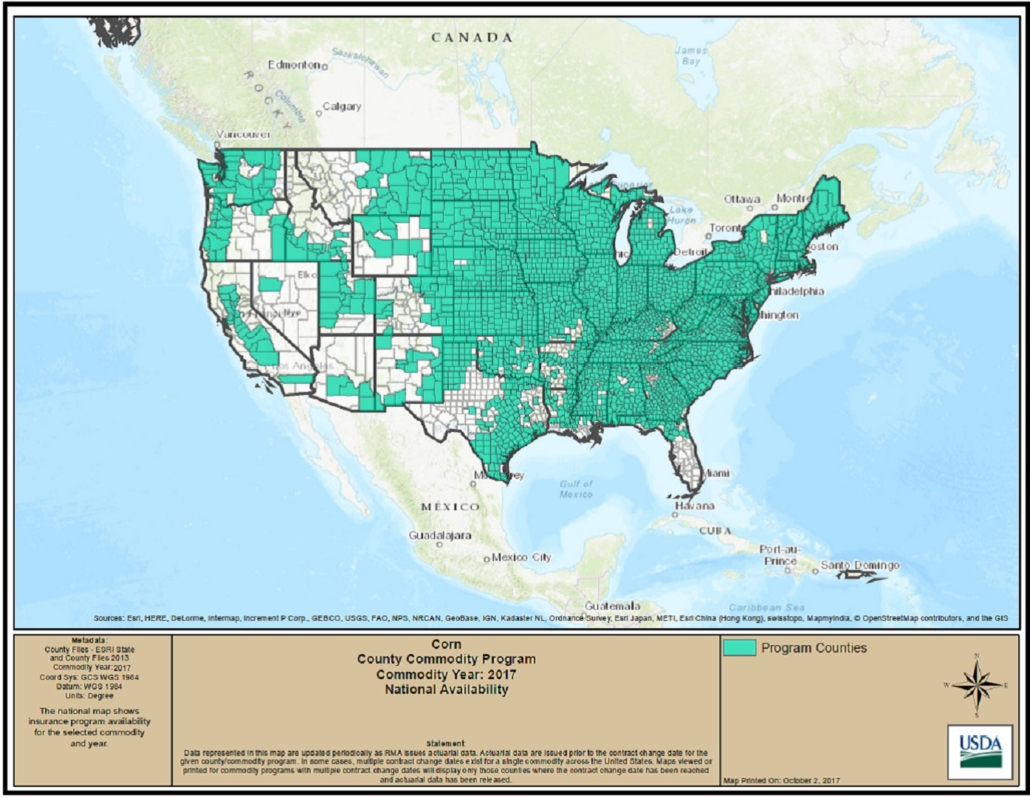
Figure 4: Counties with Apple Insurance Policies in 2017. Source: Risk Management Agency (RMA), 2017c.

Figure 5: Counties with Corn Insurance Policies in 2017. Source: Risk Management Agency (RMA), 2017d
Special Requests—Exceptions in Some Cases
The general rule is that there are no options for federally subsidized insurance if a policy for a particular crop or livestock product is not currently available in your county. However, RMA has provided a process for requesting coverage if a policy isn’t available to you. It’s worth noting, though, that the request does require extensive documentation of your historical production of the crop in question, as well as other expert opinion about the possibility of growing the crop in your location. In other words, you may be able to convince RMA that organic apple production is possible and thus insurable in Montana. An Internet link to an RMA fact sheet detailing how to request insurance that isn’t available in your county is listed in the Further Resources section at the end of this publication.
Whole-Farm Revenue Protection Insurance
Diversification, Specialization, and Insurance Costs—the Whole-Farm Alternative
Federal commodity and specialty-crop insurance generally is not set up to support highly diversified farm production but, rather, to serve farms with higher volumes and largely wholesale-marketed production. While it is possible to purchase individual specialty-crop polices for multiple crops if they are available in your county, this is not often a practical option for a diversified farmer. For instance, if you grew apples, sweet corn, green peas, and green beans in Brown County, Wisconsin, it would be possible to purchase separate insurance policies for each crop. In this rather unusual case, however, the policies for sweet corn, green peas, and green beans also would require a contracted purchase price with a processor, which in turn would generally mean one would have to produce a significant volume of the crop. Thus, even a larger-scale producer of these crops would not have a way to insure all of them separately if they were marketed directly to consumers. Fortunately, there is one alternative federally subsidized insurance option for highly diversified organic and specialty crop farmers of varying scale, and that is Whole-Farm Revenue Protection (WFRP) insurance.
As mentioned earlier, WFRP takes a significantly different approach to crop insurance by insuring the average adjusted gross revenue of the farm, regardless of the variety of products the farmer grows. Insuring whole-farm revenue, rather than taking out policies for separate crops and livestock, is generally less expensive, because the risks of loss are pooled across the various crops and livestock products.
Policy Basics
WFRP was created as part of the 2014 Farm Bill and was developed by the merging of two predecessor policies known as Adjusted Gross Revenue (AGR) and Adjusted Gross Revenue Lite (AGR-Lite). Its maximum liability coverage is $8.5 million, which means that a farm with up to $10 million in actual approved revenue could apply, because the highest level of coverage is 85% of actual approved revenue. There are also limits of $1 million in liability coverage for livestock and for greenhouse and nursery products.
At first, WFRP was limited in availability to certain counties and states, but it is now available nationwide and is the first subsidized crop and livestock policy with national availability. The policy is based on the adjusted gross revenue of all commodities produced by the farm, based on farm tax records. For most farms, this is the Internal Revenue Service (IRS) Schedule F form, but equivalent IRS forms can be used. Most commodities and livestock products are eligible, with the exception of timber, forest, and forest products, as well as animals for sport, show, or pets. Data from the tax forms is adjusted to make sure the farm-revenue information is strictly from the production of crops and livestock; hence, the term “adjusted” gross revenue.
Also, since WFRP is tied closely to tax records, RMA has provided different start and policy-sales-closing dates for the insurance coverage, depending on whether the producer files taxes based on a Calendar Year, Early Fiscal Year, or Late Fiscal Year. The sales-closing and policy-start dates for Calendar Year and Early Fiscal tax filers are January 31, February 28, or March 15, depending on where you are located, and November 20 for Late Fiscal tax filers. Check with your crop-insurance agent for the specific dates based on your location and tax-filing situation.
The premium cost for WFRP is determined, in part, by calculating the approved adjusted revenue of your farm based on information provided on the Whole-Farm Operation and Intended Farm Operation Reports. These are explained in detail in the three examples that follow. Basically, a farm’s approved gross revenue for insurance coverage is the lower of either the intended gross revenue in the year of insurance or the average historic whole-farm revenue of the farm. The basis of coverage, premium determination, and causes of loss and indemnity payments under the policy include the following:
1. Commodity Count and Coverage Levels
The number of commodities that determine the level of diversification of the farm and available level of coverage is determined by the Commodity Count as defined by RMA. This not always the same as the actual number of crop and livestock products, as RMA has a very specific list of crop and livestock products that can be covered in each county. However, when a specific commodity is not available on the RMA list, there are options like “other crop” or “other animal product” that can be used. Note that using the “other” commodity option will likely raise your premium costs. Nonetheless, higher diversification of products leads to a lower premium cost and higher premium subsidy. Commodity Count is calculated by the number of products with distinct commodity codes (as determined by RMA) and how much each of these specific commodities contributes to total revenue. A commodity must contribute a minimum amount of revenue to count as a distinct commodity, according to a formula provided in the policy. The calculation of Commodity Count for a farm that grows $100,000 in total gross revenue from corn, peas, green beans, mums, and geraniums can provide an example:
Expected revenue from each commodity:
Corn: $50,000
Peas: $20,000
Green Beans: $25,000
Mums and Geraniums: $5,000 (counted together because they have same RMA commodity code.)
Calculation of the Commodity Count in this example would be done as follows:
[(1÷ 4 commodities) x 0.333 = .08325] x $100,000 total revenue = $8,325
The idea of the formula is to provide a means to determine the commodity-qualifying revenue threshold for the farm. In this example, the farm’s Commodity Count is only three, because the combined mum and geranium income does not meet the qualifying revenue threshold of $ 8,325 dollars. A Commodity Count of three is required to obtain the coverage levels of 85 and 80% of total approved adjusted gross revenue. A minimum Commodity Count of only one is required to be eligible for the 70, 65, 60, 55, and 50% coverage levels. Higher Commodity Counts beyond three lead to lower premium costs and higher subsidies. It is possible for a farmer to purchase a WFRP policy at the 70, 65, 55, and 50% coverage levels with a single commodity if revenue or actual revenue history insurance is not available for that product in the farmer’s location.
Producers should be aware of an additional limitation for the Commodity Count. If the primary commodity is potatoes, there have to be two additional commodities to be eligible for a WFRP policy. Potatoes have a special exclusion from WFRP, written into the 2014 Farm Bill legislation.
2. Total Adjusted Gross Revenue for the Insurance Year—Intended Farm Operation Report
To determine adjusted gross revenue in the insurance year, the producer must file an Intended Farm Operation Report, which provides information about the following topics:
- what commodities the producer intends to produce
- the method of establishment of the commodities
- expected yield per unit of the commodities
- expected revenue from the commodities
- intended production quantity of the commodities
- whether the value of the crop is determined on a cost basis
- the share of production for the farmer or rancher, and
- the total expected revenue from each commodity.
This information is collected for all commodities produced by the farm in the insurance year, and the total expected revenue of all commodities is summed to provide the total expected gross revenue. This total is compared to the historical average gross revenue, with the lower number of the two being used for liability determination. Finally, applicants must provide a Revised Farm Operations Report should the crop and livestock products change during the insurance year and a Final Farm Operation Report at the end of the insurance year to help with determining insurance claims under the policy.
3. Average Adjusted Gross Revenue—Whole-Farm History Report
To determine historic average adjusted gross revenue, five previous years (not including the current tax year) of Schedule F forms or equivalent would be needed. For instance, for a 2018 WFRP Policy, records for 2017 are not needed because tax information is not yet available, but records for 2012, 2013, 2014, 2015, and 2016 are required. An exception to this general requirement is that qualified Beginning Farmers and Ranchers only need three consecutive years of tax information, provided they also farmed during the past year. Beginning farmers and ranchers also are provided an additional 10% subsidy in premium cost. A beginning farmer or rancher for crop insurance purposes is one who has operated a farm or ranch for five years or less.
The RMA provides a form called the Whole-Farm History Report that must be filled out to determine adjusted gross revenue for the required years. An example of the Whole-Farm History Report is available at the end of this publication. The sum of adjusted gross revenue for each year is divided by the number of years of data required (usually five), and this becomes the historic average adjusted gross revenue of the farm. Again, this is compared to the total expected gross revenue in the insurance year, with the lower of the two numbers multiplied by the coverage level to provide what is called the “Revenue-to-Count,” which is used to calculate any indemnity payment, should losses occur.
4. Determine the Historic Approved Expenses—Allowable Expenses Worksheet
The average historical expenses of the farm over the same five years as revenue (three years in the case of Beginning Farmers and Ranchers) must also be determined, because during the insurance year expenses must be at least 70% of this average. If not, the insured revenue (Revenue-to-Count) will be reduced by 1% for each percentage point the actual expenses are below the 70% average. Work with your insurance agent to determine this average by filling out the Allowable Expenses Worksheet based on tax records or other verifiable records.
5. Causes of Loss and Notification of Loss
There are nine causes of loss covered by the WFRP policy:
- adverse weather conditions
- fire
- insects
- plant disease
- earthquake
- volcanic eruption
- failure of the irrigation water supply
- wildlife
- decline in market price (RMA, 2017f)
The decline in price as a cause of loss under the policy is “presumed to be from unavoidable natural causes unless the FCIC (Federal Crop Insurance Corporation) is able to specifically identify a man-made cause that resulted in a measurable change in the price” (RMA, 2017f). If such a human cause is identified, the part of loss attributed to such a cause is not covered by the policy. Revenue losses must be reported within 72 hours after the discovery that revenue during the policy year is below the insured revenue (Revenue-to-Count). Taxes must be filed before any claim of loss is made, and claims must be made no later than 60 days after tax filing for the covered insurance year. Losses due to pesticide drift and failure to use good farming practices are not covered.
Three Examples
Although it is very difficult to capture the extreme diversity of agriculture in the United States, below are three representative examples of WFRP insurance and other comparable insurance options for diversified, specialty, and organic farms. The examples are from a diversified organic grain farm in Minnesota; a very small, highly diverse, organic vegetable and livestock farm in Washington; and a diverse fruit orchard in Georgia. These examples offer realistic proxy data to assess crop-insurance alternatives that would be available in such cases.
The producer premium costs of alternative insurance policies are shown for each example, along with estimates of likely loss payments (or, in insurance lingo, “indemnity payments”) should these hypothetical farms experience a 50% loss of yield in the insurance year. The producer premium costs for these examples are estimated using the RMA’s online cost estimator. A link to this premium-cost estimator is provided in the Further Resources section. The insurance year used in these examples is 2016. These examples were chosen to highlight both the advantages and limitations of some options that are available. If you are interested in the types of policies that will be discussed, it is best to contact a local crop-insurance agent. The RMA website listed in the Further Resources section of this publication provides an excellent searchable database that can help you find an agent.
Example One: Minnesota Organic Grain Farm
This illustrative 800-acre organic farm is in Blue Earth County, Minnesota. It produces 200 acres each of organic soybeans, corn, barley, and oats. To provide some realism to the example, acreage and yield and price data used are based on 2012 average data from selected organic farms as reported in 2012 Organic Farm Performance in Minnesota, published by a joint project of the Minnesota Department of Agriculture, Minnesota State Colleges and Universities, and the Center for Farm Financial Management at the University of Minnesota (CFFM, 2013). When available, RMA organic price election data from 2016 are used for the crops grown.
In this example, estimates of the cost to insure the crops by individual policies and by WFRP are contrasted. Coverage levels will be 85%, the highest level of coverage available for these crops in Minnesota. In Blue Earth County, revenue insurance with an organic price election is available for corn and soybeans, and only an Actual Production History (APH) policy is available for organic oats. No individual-crop Actual Production History (APH) or Revenue Protection (RP) policy is available for organic or non-organic barley in Blue Earth County, Minnesota, which is a limitation of individual policies, as discussed earlier.
To simplify the example somewhat, we estimated policy premium costs and payouts for the insurance year based on a scenario in which all crops suffer a 50% yield loss.
It is also important to note that because no policy is available in Blue Earth County, Minnesota, for the organic barley crop, the 50% yield loss represents an additional $27,000 revenue loss. Again, this demonstrates the earlier point about how WFRP can make up for the absence of specific policies in particular locations.
Although it is clear from this example that whole-farm insurance was a better option given this assumed and rather significant level of loss, remember that with a WFRP policy, loss payments begin only after the whole-farm revenue has experienced $132,896 in loss ($376,490 expected revenue minus $243,921 coverage level). For example, suppose that there had been only a significant corn-crop loss, and the other crops had done even better than expected. With an individual-crop policy, the farmer would have gotten a loss payment for the corn. But a farmer in the same scenario who purchased only a whole-farm policy would not have gotten a loss payment on the corn crop, unless that single crop loss was enough to cause the whole farm’s revenue to drop significantly. Again, until the whole farm drops below the coverage level of $243,921 in gross revenue, no loss payment is made. Thus the choice between buying individual crop policies or a WFRP policy is related to understanding the relative riskiness of the crops grown, as well as how a particular farm’s historical revenue compares with insurance-year expected gross revenue.
Finally, note that farmers can purchase an individual crop policy on one crop and a WFRP policy for the rest of the crops and livestock grown. This mix-and-match option for WFRP does have some restrictions. Check with your crop insurance agent about this option.
Example Two: Washington Organic, Diverse Vegetable and Livestock Farm
This example is of a much smaller farm (one acre), which is representative of direct-market farms across the United States. These farmers do not often purchase any crop insurance. This may be because they don’t know about the WFRP option. Another possibility is that the gross revenue generated by the farm does not seem to the farmer to warrant the cost of the insurance. Also, many smaller and highly diverse farms see that diversity as a form of insurance itself. Thus, even if some crops fail, there is often time to plant replacements for the lost crops. No single crop loss is likely to create a significant loss in the whole farm’s revenue. Nonetheless, a product like WFRP could provide an option.
This example uses data from a 2015 Washington State University Extension report. The choice of crops grown in this example reflects those featured in the Extension report, because of the excellent price and yield data available.
The example small, vegetable and livestock farm consists of the following:
- Crops of onions, sweet corn, snap beans, green peas, potatoes, and carrots on 20 beds, each about six feet by 350 feet (approximately an acre of crop land)
- 10 beehives with an estimated production of 100 pounds of honey per hive
- 48 laying hens with an estimated production of 3.5 dozen eggs per day.
Table 6 shows the farm’s adjusted gross revenue of $32,857, crop and livestock yields, and price data for the year of insurance (2016). Again, we will estimate the loss payment resulting from a 50%loss in yield for all the products produced.
In this example, it is difficult to compare a WFRP policy with other insurance options because in Lewis County, Washington, there are no individual crop-insurance options available for onions, snap beans, potatoes, or carrots, as well as no individual policies available for honey or eggs.
Actual Production History (APH) policies are available for organic “shelled” green peas and organic sweet corn. However, the policies for these two crops are geared toward large production for processors, rather than the direct-marketers in this example. Also, the price elections for an APH policy for these crops are based on a contracted price for the respective crop, and because the prices are for wholesale processor markets, they are generally lower than direct-market prices. For example, in 2016 the organic sweet corn contract price election in this example was limited to a maximum of $223 per ton, well under the expected price for direct-marketed organic sweet corn of $554 per ton. As noted earlier, this example demonstrates the limited availability of crop insurance for the smaller, direct-market producer.
It is important to note that the Revenue-to-Count value was not the simple historic average of gross revenue ($25,532) but rather what is called an “indexed” value of $30,792. Indexing is a feature of WFRP and is determined by a formula for weighting the average gross revenue upward, based on whether farm gross revenue in more- recent years is significantly higher than in earlier years. This indexing impacts both indemnity and premium calculations. An additional “Expanded Operation” benefit is also available when the farm has an actual physical expansion during the five years considered. Check with your crop-insurance agent as to whether you qualify for indexing or the expanded-operation benefits.
Example Three: Georgia Diverse Orchard
The final example is a 10-acre diverse fruit orchard in Bacon County, Georgia. The farmer grows three acres of blueberries, four acres of apples, and three acres of peaches, all marketed directly to consumers and restaurants. Published data for organic yields and prices for tree fruits are very difficult to find. In this example, yield data is based on what are called “T-yields,” or transition yields, as provided by RMA. T-yields are based on historical average yield of the crop for a county. T-yields for 2016 in this example are from Bacon County in the case of blueberries and peaches and from Fannin County in the case of apples. Fannin County is one of only three counties in Georgia where apple crop insurance is available. The T-yields published by RMA for organic and non-organic production of these three tree fruits are the same and are likely based on non-organic yields. Price data is loosely based on price elections also provided by RMA, but they were set higher than the RMA data since that is based on non-organic average data, and because direct-market prices are likely to be higher. The farmer intended to receive $40,910 in gross revenue from this production in the 2016 insurance year.
In Bacon County, Georgia, there are no individual crop-insurance policies for organic or non-organic apples. Peaches and blueberries have Actual Production History (APH) policies available. However the APH crop policies for peaches only provide a maximum 75% yield coverage, as compared to the 85% WFRP coverage. Table 11 provides a comparison of the costs and loss payments for individual policies and WFRP. Again, WFRP offers greater protection for a 50% yield loss, as it provides an estimated $8,198 gain after premium costs. The individual policies provide only a $ 2,337 gain after premium costs. The premium cost is higher for the WFRP, although this higher cost is very modest considering WFRP’s higher coverage level. There is also no individual-crop policy protection for the farmer’s apples. In addition, the price elections for the Actual Production History (APH) policies for peaches and apples are lower than the actual prices received by the farmer and are based on non-organic prices, as noted above. This means the producer cannot insure these organic products for their higher value. Finally, the premium for the WFRP for this farm is based on an indexed historic average revenue of $37,232, rather than a simple average, again providing better coverage due to historic expanding revenue.
However, there are a couple of considerations to keep in mind when comparing the relative benefits of either of these options for crop insurance. First, WFRP provides coverage if the loss was due to either yield- or price-related causes, while the individual policies only cover yield losses. Although we made an assumption in this hypothetical example that the loss was related only to yield, that is not likely to be the case. When it is available, revenue insurance is generally a better choice in terms of covering multiple sources of risk.
Finally, the issue of whether losses are likely to be significant across the whole farm remains an important consideration. In this example, if the peach crop was the only source of loss, and that loss did not pull the whole-farm revenue below the WFRP revenue liability level of $31,647 ($37,232 indexed average revenue X 0.85 coverage level), only an individual policy would have provided a loss payment. Again, the farmer could have mixed and matched WFRP and individual policies and thereby optimized coverage, if the relative risk of each crop could be easily understood.
Conclusion
According to a USDA Economic Research Service report, only a little more than 16% of farm households in the United States participated in the crop-insurance program in 2015 (ERS, 2016). Clearly, despite agriculture’s “multiple perils,” product-price volatility, and significant subsidization of the costs of crop insurance, crop insurance still is not used by many farmers in the United States. Indeed, one recent analysis argued that very few, if any, farmers would purchase crop insurance if they had to pay the actual costs of the policies (Smith, 2011). However, despite the significant number of farmers who do not use crop insurance, many major commodity-based farms do, and they are likely to continue to support this valuable benefit for limiting risk. Also, the total level of subsidization offered could continue to increase as either the value of insurable crops rises or the number of farmers using the policies increases.
There is no easy or simple way to determine insurable risks when you are assessing the crop and livestock production risks and price risks of your farm. Good farm planning, careful recordkeeping, and sound financial management are likely as important as the decision whether to carry crop insurance. Indeed, without the information that such efforts create, it would be hard to determine the degree to which you experience crop and livestock losses or to what degree the prices for your production vary over time. Collecting that information is also necessary for purchasing policies and for full reimbursement of insurable losses. Several publications on farm business management and planning are available from ATTRA. See the Related Publications mentioned at the beginning of this publication.
As the information in this publication aptly demonstrates, there are many, often confusing, crop-insurance options for the highly diverse, specialty, or organic farm. Indeed, the more complex and diverse the farm enterprise is, the more complicated it becomes to assess the various options for insurance. Also, although there are more specialty-crop and livestock policies available, they are often available only in a few locations, have confusing eligibility requirements, and do not have easily assessable benefits. Nonetheless, farms that specialize in certain crops while growing a large diversity of other crops and livestock could find the WFRP policy particularly useful. Whatever the degree of crop and livestock diversity, it is always worthwhile to work with a local crop-insurance agent to explore the many options and details of the various alternatives that have been discussed in this publication.
In conclusion, products like WFRP show great promise for insuring diverse, specialty, and organic production. Indeed, the idea that farmers should concern themselves primarily with the set of crops and livestock that will promote greater profitability and sustainability is paramount. Concern with insuring crop production and price risks is perhaps only of secondary importance. Too often, farmers are trapped into growing the same few crops or livestock because they are the only options for which good insurance is available. The risk in launching a potentially profitable new enterprise can be significant. Insuring the whole farm’s revenue can perhaps offer greater opportunity to add new profitable enterprises and sustainable diversity without literally “risking the farm.
Crop Insurance Options for Specialty, Diversified, and Organic Farmers
By Jeff Schahczenski, NCAT Agriculture Economist
Published July 2012, updated January 2018
© NCAT
IP438
Slot 439
This publication is produced by the National Center for Appropriate Technology through the ATTRA Sustainable Agriculture program, under a cooperative agreement with USDA Rural Development. ATTRA.NCAT.ORG