

Rangeland App: Modern Tool for Graziers
By Darron Gaus, NCAT Agriculture Specialist
Rangeland managers, whether grazers or wildlife conservationists, have many decisions to make about vegetation in their fields and the soil sponge that the vegetation covers. These decisions can be overwhelming when planning and learning from past data. The University of Montana, through funding from multiple U.S. Department of Agriculture (USDA) programs and the Bureau of Land Management, has created an online resource called the Rangeland Analysis Program (RAP) to help land managers make decisions by visually displaying vegetation data for the United States.
RAP takes satellite imagery taken since 1986 and compares it with over 75,000 on-the-ground monitoring protocols to make a data-driven model of any rangeland in the United States. The two data points that RAP focuses on are percent ground cover and annual biomass. With these two data sets, rangeland managers can look as far back as 1986 and see what changes occurred on their land and where things might be headed because of current practices.
There are multiple tools developed on the Rangelands App website, including RAP, Production Explorer, cheatgrass app, Great Basin fire probability, and historical imagery. RAP gives data for percent ground cover broken down into perennial forbs and grasses, annual forbs and grasses, shrubs, trees, and bare ground. Once boundaries have been drawn for the property, a valuable graph, such as Graph 1 below, is generated and capable of being downloaded as a CSV or Excel file for later use.
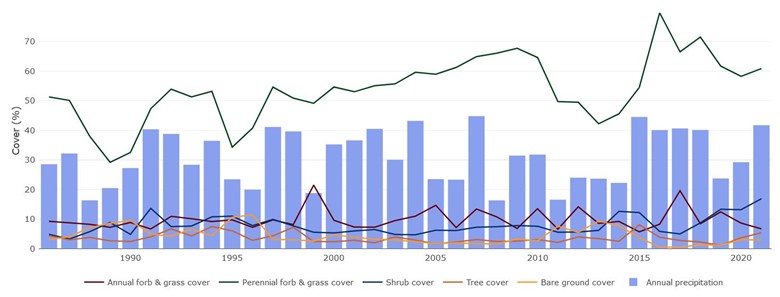
Graph 1. Percent Cover
The percent cover table is automatically integrated with annual precipitation to easily see changes in comparison to the precipitation that year. RAP also generates a biomass average of each year in pounds per acre, such as Graph 2 below. Lastly, RAP can give 16-day averages over a given year to more accurately see when peak production for each field occurs.
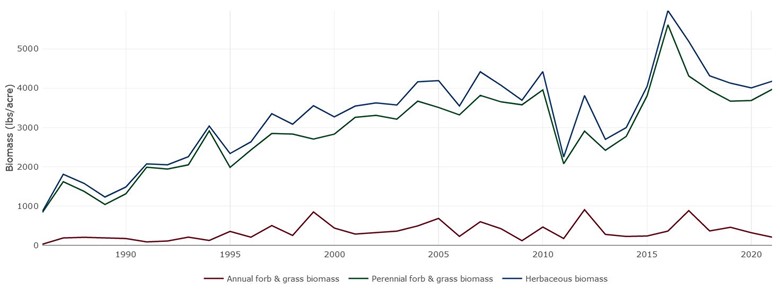
Graph 2. Biomass in Lbs/Acre
Visualizing all this data can help managers make accurate assessments for their operation. Mostly this data could be used for making stocking rate decisions across the operation. The Rangeland App website makes this decision even easier with the Production Explorer tool, which does all the calculations for the user to give a maximum, minimum, average, and suggested stocking rate. Graph 3 below shows an example, including all the calculations used for the results. The manager can then use this information to better inform risk assessment over the last 35 years.
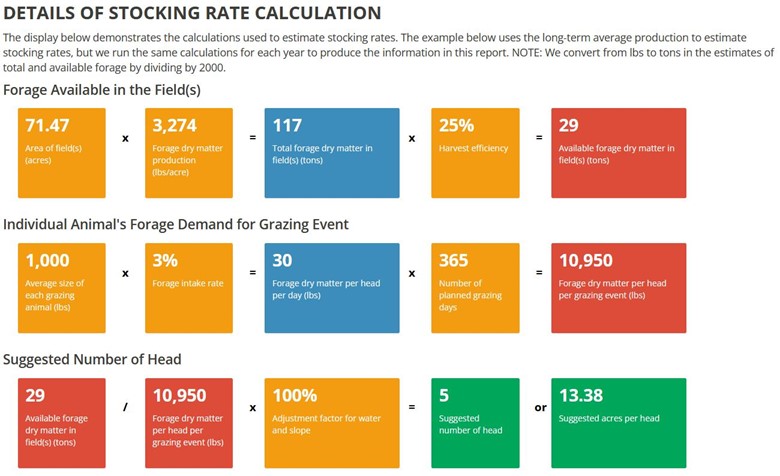
Graph 3. Stocking Rate Calculations
Users in Montana, Wyoming, and Idaho can utilize the historical imagery tool. Seeing the shape and contour of the land with 35 years of growth or destruction can be an especially useful tool. It allows managers to see if certain management practices have helped or harmed the overall lay of the land.
The Rangelands App website tools make managing pastures as easy as a few clicks. Modern tools like this can make decision-making easier for grazers and wildlife conservationists, as well as save time and document change due to management. Share what modern tool you use to manage the land at the Soil for Water Forum.

 NCAT
NCAT


