The Periodic Table of Cover Crops
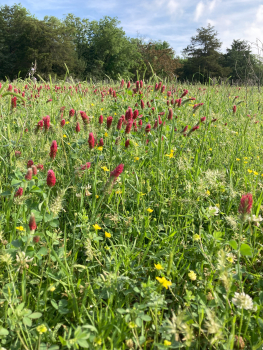
Photo: Nina Prater, NCAT
By Cody Brown, NCAT Agriculture Specialist
Contents
Introduction
How to Use the Periodic Table of Cover Crops
Periodic Table of Cover Crops
References
Introduction
The Periodic Table of Cover Crops is a visual tool for producers interested in utilizing cover crops on their farms or ranches. The overall layout of the cover crop selection tool is meant to mimic the organized structure of the periodic table of elements. Where the plant is located on the chart, the color of the box, and the numbers and icons in the corners of the box all provide information relevant to that plant. This table is meant to be an easy-to-use, handy reference to help land stewards find the most suitable cover crop plants to help achieve their soil health goals.
It is important to note that information on specific crops is generalized and approximate and may not reflect performance in on-farm conditions.
How to Use the Periodic Table of Cover Crops
There are eight data points for each plant within its square on the periodic table: plant name, function, root type, plant structure, crude protein, life cycle, biomass per pound of seed, and carbon-to-nitrogen (C:N) ratio.
This table also includes three criteria that determine the plant’s location on the chart: seasonality (warm vs. cool season), plant type (grass, legume, or broadleaf) and water demand (low vs. high water needs).
Function
The term listed in the upper left-hand corner of each square represents the most notable function for this plant. It is not the only function
the plant has; the plant can still be used for other purposes.
You will find these functions in the table:
- Erosion control: plants that help slow water movement with their fibrous roots or prostrate growth.
- Weed suppression: plants with prostrate growth that crowds out weeds.
- Nitrogen scavenger: plants that collect nitrogen from the soil and store it.
- Beneficials: plants known to attract beneficial insects to the landscape.
- H2O infiltration: plants with tap roots that loosen hard soils and provide water pathways.
- Phosphorus (P) and potassium (K) scavenger: plants that collect these nutrients from the soil and store them.
- Allelopathic: plants that produce biological compounds that influence other plants and seeds.
Root Type
The type of root a plant has gives you an idea of what effect that plant will have below the soil surface. A taproot is a large root that grows straight down. Fibrous roots grow and spread outward and are smaller in diameter than taproots.
Scenario: A farmer has a heavy, compacted soil and is looking to break up the dense clay. They may look for a plant with a taproot, because it will work like a biological drill to help loosen the clay and create macropores in the soil profile.
Plant Structure
The above-ground structure of the plant and its growth habit should match the producer’s goals, enabling them to use cover crops while creating the conditions required for a successful cash crop.
Scenario: A land manager uses grazing to terminate cover crops. A taller mix of plants may produce good forage but might make it hard to observe or count the herd or flock. On the flip side, taller plants may provide shelter and protection from aerial predators for smaller livestock.
Scenario: A vegetable grower who wants to plant their cash crop directly into the cover crop may look for plants with a prostrate growth habit rather than upright, so the cash crop can get the sunlight it needs.
Crude Protein Percentage
A plant’s crude protein percentage is important to producers using the cover crop for livestock feed. The number on this table is an average; different varieties within a plant species might have higher or lower protein content than this average.
Different types of livestock each have their own dietary needs and protein requirements, so it is important to know this value when making a feed mix. Too much or too little protein both have impacts on animal performance.
Scenario: A land manager has a pasture that is dominated by warm-season grass, and they want to boost the protein percentage of the summer forage. They would look for a plant with a high percentage of crude protein that also does well in the warm season.
Life Cycle
The life cycle of a plant (annual, perennial, or biennial) will determine how long you can expect it to grow and whether it will come back the following year or years.
Scenario: A land manager needs a quick cover crop between cash crop plantings, so they select a mix of annual plants for that field, ensuring the cover crop will not persist and become a weed.
Biomass per Pound of Seed
This value will help land managers decide how much seed they need to plant to get the desired biomass. This plant characteristic is often represented as biomass per acre; the value on this table is derived from that number to be more useful for small-scale producers. A high biomass per pound of seed generally equates to a larger plant with a lot of leaves, like corn.
Scenario: A rancher in South Texas wants a cost-effective cover crop that will produce a lot of quality feed for cattle and sheep in the heat of summer, so they may choose a Sudan grass mix, which has a high biomass per pound of seed, as well as heat tolerance.
Carbon: Nitrogen (C:N) Ratio
The carbon: nitrogen ratio is an indicator of the durability of the plant, i.e., how long it takes to break down in the field. The higher the carbon content, the longer it takes the plant to break down. This ratio indicates how long you can expect the cover crop residue to remain in the field.
Scenario: A farmer is planning to plant a fall cover crop and wants it to last through the winter to protect the soil until the spring crop is established. They would look for a plant with a medium C:N ratio to ensure the residue lasts through the winter. A plant with a high C:N ratio would also persist, but could lock up nitrogen, making it unavailable for the spring crop.
Other Considerations
Native prairie grasses: These plants evolved to thrive in deep, healthy prairie soils. Therefore, they will struggle to thrive in degraded soil. If you want to establish a perennial cover of native grasses, which are shown at the bottom of the periodic table, start by focusing on soil health to create the right environment for these species to thrive.
Salinity: Not all plants tolerate soils with high salinity levels, so it’s important to know your soil’s salinity (i.e., salt content) when choosing cover crops. Some options for grasses that tolerate saline soils appear at the side of the periodic table.

References
Clark, Andy. 2012. Managing Cover Crops Profitably. 3rd ed. Sustainable Agriculture Research and Education (SARE). Beltsville, MD.
Midwest Cover Crops Council (MCCC).
USDA – ARS Northern Great Plains Research Laboratory. 2023. Cover Crop Chart. Sept 25. Home page.
USDA-NRCS. Nd. PLANTS Database.
USDA-NRCS. Nd. Technical Documents. Plant Materials Documents Search.
This updated cover crops chart was originally created by NCAT Agriculture Specialist Cody Brown and Dr. Ken Mix (Texas State University, The Small Producer Initiative). This image has now been properly illustrated and made into shareable formats with funding from SSARE, Farmers for Soil Health, and NCAT’s ATTRA program.

The Periodic Table of Cover Crops
By Cody Brown, NCAT Agriculture Specialist
Published November 2025
©NCAT
IP672
Version 022426
This publication is produced by the National Center for Appropriate Technology through the ATTRA Sustainable Agriculture program under a cooperative agreement with USDA Rural Development.