
Ag Efficiency: Focus on the 20%
 Print This Post
By Hakeem Holmes, NCAT Agriculture Specialist
What is the real source of the problem? As farmers, we probably ask ourselves this question often, when we are confronted with the many challenges that arise within our agribusiness operations. Farmers deal with a complex web of processes in diverse areas that may be under their purvue, including crops, livestock, finance, recordkeeping, harvesting, marketing, etc. How do we as farmers determine where to focus our effort and resources to resolve the issues that may arise on our farms?
Although it is important to resolve all issues on our farms, tracking the frequency of occurrences and the time/cost of a particular issue may help us decide which problems to focus on resolving in a more strategic manner. Let’s look at the Pareto Principle, which states that 80% of effects are caused by 20% of possible causes. So, what does that mean in an agriculture sense? Let’s suppose that a farmer wants to know why he is experiencing low crop yields, and after brainstorming he has determined that five areas are likely causes (Labor, Tools, Materials, Management, and Methodology). Let’s create a table of processes that are found underneath those categories to keep track of errors that occur.
| Farm Crop Yield Process Error Tracking Table | ||||
| Labor | Tools | Materials | Management | Methodology |
| Employee Count Inefficient | Hand Tools | Seeds/Transplants | Planting Schedule | Planting Technique |
| Machinery | Pesticides | Harvesting Schedule | Plant Health Monitoring | |
| Irrigation | Plant Supplements | Logistics | Harvesting Technique | |
| Marketing of Produce | Storage | |||
After listing the processes that are found under each category, the farmer can begin monitoring and counting errors that occur in each process. This information will be used to build the Pareto Chart and help the farmer to keep track of errors.
| Category | Error Count |
| Methodology | 77 |
| Management | 46 |
| Tools | 22 |
| Materials | 18 |
| Labor | 8 |
After a month of observation, the farmer can now examine error count information and create the Pareto Chart. First, let’s add additional rows and columns to the table to capture the total of observed errors and the percentage of each category contributed to the total.
| Category | Error Count | Percentage | Cumulative % |
| Methodology | 77 | 45% | 45% |
| Management | 46 | 27% | 72% |
| Tools | 22 | 13% | 85% |
| Materials | 18 | 11% | 96% |
| Labor | 8 | 4% | 100% |
| TOTAL | 171 |
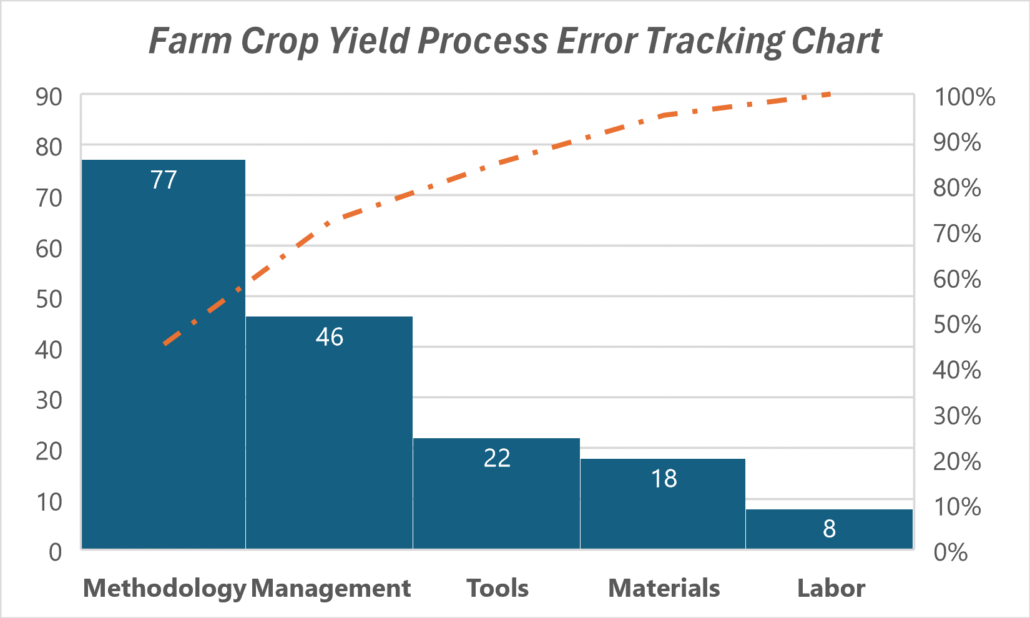
As you can see in the table above, using the methodology related to low crop yields, which is the largest cause of errors, we can resolve nearly half of observable errors. If we strategically focus on improving processes in the highest two categories, we could potentially reduce the causes of low crop yield by 72% on this farm.
The graphic below is a Pareto Chart of the same information above, and it visually shows the categories in descending order and includes a trend line that shows the rise of the percentage of responsibility of the overall observed errors. The next step would be to create more Pareto Charts of individual categories to better narrow down the different observed errors in each group to best prioritize what to resolve.
Hopefully, this blog provides you with a tool you can implement with your on-farm problem-solving adventures and shows how many times to see the big picture you should focus on the 20%.
Related ATTRA Resources:
Scaling Up Your Vegetable Farm for Regional Markets
Evaluating a Farming Enterprise
This blog is produced by the National Center for Appropriate Technology through the ATTRA Sustainable Agriculture program, under a cooperative agreement with USDA Rural Development. ATTRA.NCAT.ORG.


