Nutrient Management in Organic Small Grains
By Susan Tallman, CCA, NCAT Agronomist
Abstract
This publication provides information on sources of fertility for organic small grains that are acceptable according to the USDA National Organic Program standards.
Contents
Introduction
Nitrogen
Phosphorus
Potassium
Calcium, Magnesium, and Sulfur
Micronutrients
Conclusion
Case Study
References
Introduction
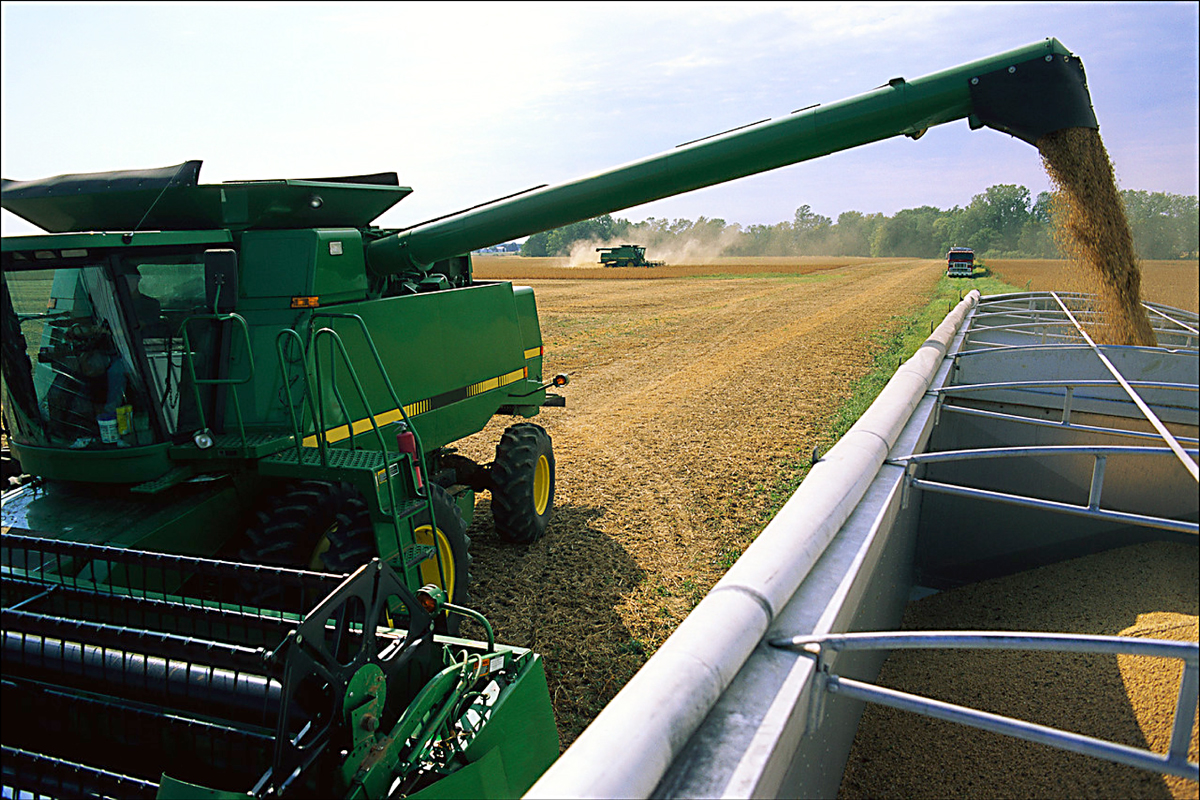
Growing organic small grains can be a rewarding enterprise, both financially and philosophically. Farmers can enjoy price premiums above the conventional market and can feel a sense of satisfaction from increased self-reliance as they use fewer purchased inputs than conventional farmers.
While there are many positive aspects to organic production, there are also challenges that require increased care and management compared with conventional production. One such challenge is nutrient management. When first starting in an organic system, many farmers overlook this issue. However, the longer a farm is in organic production, the more important this consideration becomes. An organic farmer must pay careful attention to managing the soil fertility of his or her organic small grains system. Without this attention, crop yields will decrease over time and the system as a whole will become more susceptible to attack from disease, insects, and weeds. Long-term lack of attention to soil fertility will eventually lead to the failure of the farm.
While organic farming seeks to produce crops in a way that mimics natural biological processes, it still works within the constraints of a nutrient budget. In other words, the crop draws nutrients from the soil and these nutrients exit the system when the grain is harvested. If this happens for many years without nutrients being added, the soil becomes depleted and will no longer produce favorable yields. This is the basic concept of a nutrient budget: Nutrients are removed at harvest and must be replaced to ensure long-term sustainability.
The purpose of this publication is to explain the National Organic Program regulations on soil fertility and provide information on how crop nutrients can be obtained through sources acceptable for organic production.
USDA National Organic Program Standards
The USDA National Organic Program (NOP) regulation §205.203 contains the specific requirements of the Soil Fertility and Crop Nutrient Management Practice Standard and can be accessed at the NOP website.
A paraphrased version of this standard might read as follows:
- Tillage must maintain or improve soil health and minimize erosion.
- The farmer must manage soil fertility through rotations, cover crops, and the application of plant and animal materials such as manure or compost.
- These additions of plant and animal materials (manure and compost) must help to maintain or improve soil organic matter levels and cannot cause crop, water, or soil contamination with pathogens, heavy metals, or prohibited residues.
- There are specific requirements for application of raw manure that must be followed.
- Composted manure must be processed according to specific guidelines.
- Plant materials are not required to be composted prior to land application.
- Nutrients applied can take several forms, including:
a. Any substance on the National List of Allowed and Prohibited Substances allowed for use in organic crop production
b. A mined substance of low solubility (ex. rock phosphate)
c. A mined substance of high solubility, such as potassium chloride (KCl), as long as it is used in compliance with the conditions on the National List of Allowed and Prohibited Substances regarding nonsynthetic materials prohibited for crop production
d. Ash from burned plant or animal material, except:
i. Plant or animal material treated with or containing a prohibited substance
ii. Ash from burning manure is not allowed
iii. Burning cannot be used as a means of disposal for crop residues
e. Sewage sludge (biosolids) cannot be used
Nutrient Budgets
In order to maintain adequate soil fertility, it is important to know how much nutrient material each crop removes from the soil. With this knowledge, a farmer can calculate the amount of fertilizer required to replace these nutrients. The following table shows nutrient removal rates for some common small grain crops, including buckwheat.
| Table 1: Estimated Nutrient Uptake in Harvested Portions of Small Grains Crops, Montana | |||||||||||||
| Crop | Unit | Test Weight lbs/bu | N | P2O5 | K2O | Ca | Mg | S | Fe | Zn | Mn | Cu | B |
| lbs | lbs | lbs | lbs | lbs | lbs | lbs | lbs | lbs | lbs | lbs | |||
| Barley– grain | bu | 48 | 0.87 | 0.36 | 0.25 | 0.025 | 0.05 | 0.08 | 0.0015 | 0.0008 | 0.0008 | 0.001 | |
| Barley – straw | ton | 14 | 4.1 | 30 | 7.6 | 2 | 3.8 | 0.045 | 0.3 | 0.01 | |||
| Buckwheat | bu | 48 | 0.86 | 0.16 | 0.22 | ||||||||
| Oats – grain | bu | 32 | 0.6 | 0.24 | 0.17 | 0.024 | 0.04 | 0.06 | 0.0006 | 0.001 | 0.0004 | ||
| Oats– straw | ton | 12.2 | 5.8 | 33 | 0.4 | 4 | 4.6 | 0.145 | 0.015 | ||||
| Wheat – grain | bu | 60 | 1.25 | 0.62 | 0.38 | 0.025 | 0.15 | 0.08 | 0.0035 | 0.002 | 0.0008 | 0.001 | |
| Wheat –straw | ton | 14.5 | 3.6 | 25 | 4.4 | 2.2 | 3.7 | 0.03 | 0.11 | 0.007 | |||
| Note: These figures are based on Montana guidelines. Check with your state Extension service for estimates relevant to your specific location. | |||||||||||||
| Source: J. Jacobsen, G. Jackson and C. Jones. 2005. Fertilizer Guidelines for Montana Crops. Montana State University Extension Service #EB 161. p. 24-25. | |||||||||||||
There are 17 essential elements necessary for healthy plant growth: carbon (C), hydrogen (H), oxygen (O), nitrogen (N), phosphorus (P), potassium (K), calcium (Ca), magnesium (Mg), sulfur (S), boron (B), chlorine (Cl), copper (Cu), iron (Fe), manganese (Mn), molybdenum (Mo), nickel (Ni), and zinc (Zn) (Gilmour, 2009). Plant growth will be limited by whichever nutrient is least available.
Of these essential nutrients, the first nine are considered macronutrients. They are needed in much larger quantities than the other eight nutrients (micronutrients). Of these nine macronutrients, nitrogen, phosphorus and potassium are the three most important, since they are needed in such large amounts relative to the others.
Nitrogen
Nitrogen is essential for crop growth. It’s necessary for protein synthesis, found in chlorophyll, and is a key component of energy transfer (Gilmour, 2009). Of all the essential elements, nitrogen is the only one that can be converted from the atmosphere to a plant-available form by fixation. All other essential elements must be added from outside the crop system via some type of direct input.
This conversion of atmospheric nitrogen takes place in the rhizobia bacteria in the roots of legumes. Consequently, legume green manure crops are important for supplying nitrogen and building soil health in an organic small grains system. Most organic small grains farmers depend on legume green manure crops to provide nitrogen. While green manures represent the most common source of nitrogen for organic small grains, animal manure can also furnish substantial amounts of organic nitrogen.
Calculating Nitrogen Needs
In order to determine the correct amount of nitrogen to apply, a producer should know how much is needed to produce the planned crop and how much is already available. Because nitrogen is very mobile and volatile, nitrogen budgets must be calculated anew for each crop year. There are three main methods to calculate nitrogen needs: soil tests, crop removal rates, and grain protein levels.
Soil Tests
Before growing organic grains, take a soil test of your fields to determine the nitrogen level. Once you know this level, you can calculate how much nitrogen you need to apply to meet specific crop needs adequately.
In Table 2, Montana soil test levels are correlated with yield potential to give a final nitrogen application recommendation. Check with your local Extension service for fertility guidelines based on soil test results in your area.
| Table 2: Winter Wheat N Guidelines Based on Soil Analysis | |
| Yield Potential (bu/acre) | Available N (lbs/acre) Required |
| 30 | 78 |
| 40 | 104 |
| 50 | 130 |
| 60 | 156 |
| 70 | 182 |
| 80 | 208 |
| 90 | 234 |
| Source: J. Jacobsen, G. Jackson, C. Jones. 2005. Fertilizer Guidelines for Montana Crops. Montana State University Extension Service #EB 161. p.20 | |
As an example, assume that the yield potential of winter wheat for a farm is 50 bu/acre. A fall soil test for N levels shows there are 70 lbs of N/acre currently available in the soil. Because 130 lbs N/acre are required, the farmer would need to apply an additional 60 lbs of N per acre to achieve the yield potential.
Soil testing for nitrogen should be done as close to the time of nitrogen application as possible. Test soil N levels in the spring for a spring-seeded crop. Likewise, test soil N levels in the fall for a fall-seeded crop.
Bob Quinn, a Montana organic farmer, varies the placement of green manures in his rotation depending on annual nitrogen soil test results. If nitrogen levels drop below a specific available amount, Bob will place a green manure in his rotation.
Crop Removal Rates
Another method of calculating nitrogen need is based on the crop removal rate. This approach does not involve taking a soil test. Rather, it requires consulting a crop removal rate table and adding the amount of fertilizer listed. The advantage to this method is the savings in time and expense of soil testing. The disadvantage is that it will not take into account existing nutrients in the soil, and might result in adding more nutrients than are necessary.
To use this method, consult a crop removal rate table for your area and calculate how much nitrogen is removed in the grain crop. For example, assume a crop of winter wheat produced 50 bushels per acre. According to the Fertilizer Guidelines for Montana Crops (Jacobsen et al., 2005), the grain will remove 1.25 lbs of nitrogen per bushel of grain, or 62.5 lbs of nitrogen per acre. In addition, the straw will remove about 36 lbs of nitrogen per acre (see calculation below). Assuming both the grain and the straw are removed from the field, the system will lose about 99 lbs of nitrogen per acre from this crop.
Straw Removal Calculations
When using the crop removal rate calculation, add together both grain and straw removal rates, if given separately. With time and experience, a farmer can more accurately account for straw removal based on their specific situation, since not all straw is usually removed from a field. Remember that nutrients in straw will not always be available for crop uptake the first year of decomposition.
To calculate straw removal, first estimate how many tons of straw are produced per acre. Consult your state NRCS office for these estimates, as they will vary by region.
NRCS in Montana uses the following estimates to find the amount of straw produced per acre in pounds:
Barley: Multiply 1.13 times the pounds of grain produced per acre
Spring Wheat: Multiply 1.33 times the pounds of grain produced per acre
Winter Wheat: Multiply 1.66 times the pounds of grain produced per acreThis formula assumes a test weight of 60 lbs/bu for wheat and 48 lbs/bu for barley (Engel et al., 2005).
Sample calculation:
In Montana, about 14.5 pounds of nitrogen are removed for every ton of straw produced (Jacobsen et al., 2005).
Assuming a yield of 50 bushels per acre of winter wheat results in production of 3,000 lbs of grain per acre. (50 bu/acre x 60 lbs/bu)
3,000 lbs/acre of grain x 1.66 = 4,980 lbs straw/acre
4,980 lbs straw/acre = 2.49 tons straw/acre
2,000 lbs/ton2.49 tons straw/acre x 14.5 lbs nitrogen/ton straw = 36.11 lbs nitrogen/acre in straw
Grain Protein Levels
Some organic farmers gauge their soil’s nitrogen needs by grain protein levels and forgo any laboratory soil testing. In Montana, when winter wheat grain protein levels dip to 12% and spring wheat levels dip to 13%, famers know that it is time to add some nitrogen to the soil (Engel et al., 1999). Different regions of the United States will have different protein level potentials.
Bear in mind that if protein levels dip this low, the farmer has already lost money from reduced crop quality. Therefore, this method for determining nitrogen needs is not the best from an economic perspective.
Sources of Organic Nitrogen
Green Manures
Legumes fix nitrogen (N2) from the air and convert it into nitrate-nitrogen (NO3-) that can be used by plants. This happens via a symbiotic relationship with bacterial rhizobia that live within the cells of the root. Most rhizobia are specific to particular legume species and must be applied as an inoculant along with the seed if not present in the soil.
In managing your nutrient budget, you will want to know how much N a legume green manure will contribute to the subsequent cash crop. This is called the fertilizer replacement value. This exact number is difficult to calculate, since it depends on many environmental factors that can change from season to season. Rainfall, inoculant presence, existing soil fertility, and other factors can all influence how much N is produced by a green manure crop.
Various studies have been conducted to try to quantify the fertilizer replacement value of legumes, with wide-ranging results. Available water, legume species, and timing of green manure crop termination are all important factors for nitrogen production.
Available Water
Available water is the main factor in how much nitrogen a green manure will produce. To illustrate the wide variation in nitrogen contribution of legumes as affected by soil moisture, consider Table 3, derived from research conducted in Alberta, Canada.
In this study, three different legume species were grown at four locations. Each location had different soil and climate characteristics. Notice that the nitrogen contribution for the same species of legume varied widely at different sites. For example, Sirius pea yielded anywhere from 10.7 to 71 lbs N/acre. The study revealed that the difference was attributable to rainfall: the highest-yielding Trochu site had greater rainfall in 1986, and the lowest-yielding Oyen site received only 25% of its normal precipitation in 1987.
| Table 3: Total Nitrogen Yield and Estimated Fixed Nitrogen (lbs/ac) of Annual Legumes, Alberta, Canada | |||||
| Location | Oyen | Provost | Trochu | Trochu | Rimbey |
| Year | 1987 | 1987 | 1986 | 1987 | 1987 |
| lbs N/ac | lbs N/ac | lbs N/ac | lbs N/ac | lbs N/ac | |
| Sirius field pea | 10.7 | 42.8 | 71.3 | 47.2 | 26.7 |
| Indianhead lentil | 6.2 | 7.13 | 40.14 | 35.7 | 17.84 |
| Tangier flat pea | 8.9 | 8.02 | 41 | 15 | 13.38 |
| Site-year average | 8.9 | 19.6 | 50.8 | 33 | 19.6 |
| Source: Legume Green Manuring. 1993. Government of Alberta, Agriculture and Rural Development. | |||||
Likewise, in recent crop systems field trials, the University of Manitoba found the nitrogen contributions of annual and perennial legumes listed in Table 4.
| Table 4: Fertilizer Replacement Value (lbs/ac) of Different Legumes per 1,000 lbs of Dry Matter Produced | ||
| Winnipeg | Carman | |
| Alfalfa | 48 | 2.5 |
| Red Clover | 14 | -33 |
| Chickling Vetch | 28 | 53 |
| Black Lentil | 30 | 25 |
| Source: Fertilizer Replacement Value of Legume Green Manure Crops. 2004. University of Manitoba. | ||
| Table 5: Nitrogen Fixation Potential of Various Legume Species | |
| Crop | Potential Total N Fixation |
| Red Clover | 70 – 150 lbs N/a |
| Berseem Clover | 100 – 200 lbs N/a |
| Sweet Clover | 100 – 200 lbs N/a |
| Crimson Clover | 70 – 150 lbs N/a |
| Winter Peas | 90 – 150 lbs N/a |
| Black Medic | 100 – 200 lbs N/a |
| Cowpeas | 100 – 150 lbs N/a |
| Subterranean Clover | 100 – 200 lbs N/a |
| White Clover | 80 – 130 lbs N/a |
| Source: Managing Cover Crops Profitably, 3rd ed. 2007. Sustainable Agriculture Network. | |
Winnipeg has heavy clay soil with adequate rainfall, while Carman has sandy loam soil with much less rainfall. From the table you can see the results vary widely, with red clover even depleting the soil nitrogen at the Carman site.
In addition to having an effect on the amount of nitrogen produced by the green manure, available soil moisture will also affect the amount of nitrogen taken up by the following cash crop. This consideration will be most crucial in the dry western Plains states where soil moisture is limited.
Species
Table 5 illustrates the nitrogen fixation potential for various legume species. Notice that these ranges are very wide and are entirely dependent on local factors such as rainfall and climate. Also notice that the values given are listed as potential nitrogen fixation. This number is often much greater than the actual fertilizer replacement value of the nitrogen produced, because a large percentage of N is tied up in organic matter and not immediately available to plants. Because these numbers are so wide in range, it is difficult to determine the exact amount of N contribution from each species in a particular setting.
Seeding a Green Manure Crop
While green manures build soil health and provide nitrogen to the system, seed can be difficult to find and is often expensive. Make sure you have a reliable seed source before planning your rotation for the coming year.
Timing and Method of Termination
In areas with adequate rainfall, green manures should be terminated at full bloom. At this stage, the plant will have the greatest amount of dry matter balanced with the most amount of nitrogen in the plant. If terminated later than full bloom, the legume will begin to move nitrogen into the seed pod, where it is less available for mineralization. If terminated earlier than full bloom, the plant will not have reached its full nitrogen potential. Termination should also occur prior to the green manure going to seed to avoid it becoming a weed in the following crop.
In semi-arid regions without irrigation, legumes should be terminated before full bloom to conserve soil moisture. If the green manure is allowed to grow to full bloom, it can use too much valuable soil moisture and decrease yields in the following cash crop. Researchers at Montana State University recommend terminating green manure at mid-bloom at the latest, to conserve soil moisture while still gaining some nitrogen benefit for the soil. Mid-bloom is defined as the period when fifty out of a hundred stems have flowers. Areas with more serious water considerations may even need to terminate at first bloom, or when an occasional flower can be found; usually less than ten flowers per one hundred stems.
Research in Canada has validated this delicate balance between nitrogen contribution and soil moisture management (Zentner et al., 2004). In one study, green manure lentils were grown in rotation with wheat for 12 years. For the first 6 years of the study, the lentils were terminated at full bloom, and the following wheat crop yielded 26% less than wheat crops grown after conventional fallow. This decrease was attributed to reduced soil moisture, consumed by the lentil crop. After 6 years, the researchers changed the parameters of the study and started terminating the lentil green manure earlier in the season. They also began managing the winter snow catch more aggressively by leaving the grain stubble as tall as possible. After making these changes, the wheat crop yields returned to normal and the nitrogen balance of the soil improved, meaning the legumes provided enough nitrogen to decrease the amount of nitrogen fertilizer required compared with conventional fallow.
Further Resources
Saskatchewan hosts a good website on Green Manuring with Legumes.
Likewise, the University of Manitoba has an informative article, Adjusting Soil Test N Recommendations for Legume N from Pulse Crops.
Use Non-GMO Rhizobium
Be aware that the rhizobium used to inoculate your green manure seed must be compliant with organic standards if your operation is certified organic. There are some rhizobia in the marketplace that are genetically modified, and therefore not permitted according to the NOP regulations. Also, some peat moss used to produce and carry inoculants is irradiated, and therefore not allowed under NOP §205.105(f). Check with your certifier before purchasing inoculants.
Estimating Green Manure Nitrogen Production
If the nitrogen contribution of legumes is so variable, how can we calculate their fertilizer replacement value? Assuming proper inoculation, good nodulation, and no other limiting nutrients, it seems that the nitrogen contribution of a legume is directly correlated with dry matter production and the timing of the termination. In general, the greater the dry matter yield, the greater the nitrogen fertilizer value. In the Manitoba study, researchers estimated that for every 1000 lbs of alfalfa produced per acre (on a dry matter basis), the soil received 48 lbs of nitrogen (University of Manitoba, 2004). Since dry matter production is closely correlated with rainfall and soil moisture, it follows that dry areas will experience less nitrogen contribution than wet areas. Other factors that influence water availability include soil type, evapotranspiration, and soil organic matter.
Dr. Marianna Sarrantonio explains a good way to estimate nitrogen contribution in Managing Cover Crops Profitably (Clark, 2007):
- Determine the amount of dry matter per acre in the legume crop.
- Multiply by the percent nitrogen in the crop
a. Annual legumes have between 3.5 and 4% prior to flowering, and 3 to 3.5% at flowering.
b. Perennial legumes with thick, woody stems have about 1% less than annual legume estimates.
Note: Remember to divide by 100 when using percentages. 3% is equivalent to .03.
3. Now divide by:
a. 2 if the green manure will be conventionally tilled
b. 4 if left on the surface in a northern climate
c. 2 if left on the surface in a southern climate
Sample Calculation of Green Manure Nitrogen Addition
According to this formula, if we grew a field pea with 3,000 lbs dry matter per acre that was terminated at mid-bloom with tillage, there would be about 45 lbs/acre of N contributed to the system for the subsequent cash crop.
3,000 lbs dry matter per acre x .03 nitrogen = 90 lbs nitrogen
90 lbs nitrogen / 2 = 45 lbs nitrogen per acre
Residual Nitrogen
It is important to realize that legumes will use residual nitrogen in the soil before producing nitrogen via fixation. At best, a legume will fix up to 80% of its own nitrogen, and scavenge the rest from the soil (Clark, 2007). Therefore, when planning a crop rotation, do not plant a legume after a large manure application. In this situation, the fixed nitrogen gained from the legume will be negligible.
Soil Organic Matter
The benefits of organic matter to soil fertility are twofold. First, the decomposing plant material provides nutrients to the soil. Secondly, the humus fraction of organic matter provides cation exchange sites, similar to clay.
In general, “soil will release between 10 and 40 lbs N/acre for each 1% of organic matter that decomposes” (Clark, 2007). We can estimate this amount in the following calculations:
Soil Organic Matter’s Revolving Nutrient Bank Account
- In the top 6 or 7 inches of soil = 2,000,000 lbs of soil per acre
- 1.0% SOM = approximately 10,000 lbs Carbon, 1,000 lbs Nitrogen, 100 lbs Phosphorous, and 100 lbs Sulfur
- Mineralization Rate = 2-3% from Organic N to Inorganic N, which does not stop at harvest time
- Resulting in 20-30 lbs of useable N per acre for each 1% of soil organic matter (Brady, 1990)
Animal Manure
Another source of organic nitrogen is animal manure. There are several advantages to using animal manure in a crop system. Animal manure adds nitrogen, phosphorus, potassium, sulfur, and micronutrients to the soil. It doesn’t take available water out of the soil like green manures do, and a cash crop can be grown the same year as a manure application. In addition, the amount of nitrogen added from animal manure is much easier to calculate than the amount of nitrogen added from green manure.
The disadvantage of using animal manure is that it may be difficult or expensive to come by the quantity needed for large-scale organic grain farms. Dry scraped manure or composted manure lends itself to comparatively more affordable transportation, while slurry, common in dairy and hog production, is diluted with water and must be transported in tankers. Farmers in regions with concentrated animal feeding operations may find manure more available. In fact, certain regions of the U.S. have more manure nutrient available than the local crops can use at an agronomic rate (USDA – NRCS, 1987). Due to water quality concerns, manure use in these areas is closely monitored.
Organic Standards for Manure Application
When using animal manure for crop production, be aware of the specific organic regulations for its use. The National Organic Program regulations classify manure into several categories: raw manure, processed (dried) manure, composted manure, and guano (NOP, 2010). Here are a few points to bear in mind when using these materials:
- Manure does not have to come from organic livestock to be used on organic crop land. However, the manure cannot be a source of pathogenic organisms, heavy metals, or residues of prohibited substances. If a certifying agency has concerns regarding the quality of the manure, it can ask the farmer to provide test results to prove the manure is uncontaminated.
- Raw manure must be incorporated into the soil not less than 90 days prior to harvest of a product whose edible portion does not have direct contact with the soil. Most small grains would fit into this category. If the grain portion does contact the soil before harvest, such as after swathing, the length of time changes to incorporating into the soil not less than 120 days prior to harvest.
- Notice that raw manure must be incorporated, and not left on the soil surface.
- Composted manure can be applied at any time in the growing season, with no requirement for incorporation. Specific composting requirements of time, turning, and temperature must be followed for manure to qualify as compost.
- Processed, or dried, manure can be used in the same manner as composted manure, without a time interval or incorporation requirement. To qualify for this standard, the manure must be dried to a maximum moisture content of 12% at a minimum temperature of 150°F for one hour (OMRI, 2009).
- Guano is considered to be a form of raw manure, with the same limitations on the timing of application and the requirement for incorporation.
- Sludge, or municipal waste, is not allowed in organic production.
Raw manure may increase weed populations by distributing weed seeds in the field. However, subsurface banded liquid manure tends to produce fewer weeds than broadcast applications. If produced correctly, composted manure may introduce fewer weeds than fresh manure, as the heating action in the pile can kill weed seeds (Blackshaw, 2005).
Further Resources
Manure Analysis and Application
To get the most reliable results from manure application, the manure should be analyzed in a lab for nutrient content. Nutrient amounts will vary depending on animal feed, bedding, age and type of manure, and storage. However, values from standard tables can be used to get a rough estimate of nutrient content. When working with a lab, ask for the results in fertilizer equivalents, such as pounds per ton, and not parts per million. Receiving results in the form of P2O5, K2O and TKN (Total Kjeldahl Nitrogen) may also be helpful.
| Table 6: Nutrients in Solid Manure: Approximate Fertilizer Value of Manure from Solid Handling Systems | ||||||
| Animal | Bedding or litter | % Dry | Ammonium N | Total N | P2O5 | K2O |
| lbs/ton raw waste | ||||||
| Swine | No | 18 | 5 | 11 | 8 | 5 |
| Yes | 18 | 4 | 9 | 7 | 7 | |
| Beef – open concrete lot | No | 15 | 4 | 11 | 7 | 10 |
| Beef – open dirt lot | No | 52 | 7 | 21 | 14 | 23 |
| Yes | 50 | 8 | 21 | 18 | 26 | |
| Dairy | No | 18 | 3 | 9 | 3 | 6 |
| Yes | 21 | 4 | 9 | 3 | 6 | |
| Sheep | No | 28 | 5 | 18 | 11 | 26 |
| Yes | 28 | 5 | 14 | 9 | 25 | |
| Poultry | No | 45 | 8 | 33 | 48 | 34 |
| Yes | 75 | 10 | 47 | 48 | 30 | |
| Deep pit | 76 | 12 | 38 | 45 | 25 | |
| Turkey | No | 20 | 8 | 20 | 40 | 17 |
| Yes | 25 | 8 | 22 | 45 | 18 | |
| Horse | Yes | 46 | 4 | 14 | 4 | 14 |
| Source: Livestock Waste Facilities Handbook. Third Edition. 1993. MidWest Plan Service. Table 10-6. | ||||||
| Note: These values are for planning purposes only. Test all manure prior to use to get accurate results. | ||||||
Further Resources
To find a manure testing lab in your area, contact your local Extension agent, crop consultant, or NRCS office.
When applying manure as a nitrogen source, keep in mind that “no more than half of the nitrogen content will be available in the first season (range of 25 to 50%), with the other half divided between residual value and loss to the atmosphere (volatilization)” (Bass, 2008). This remainder is not divided evenly between residual value and volatilization and is very dependent on local climate. For example, in humid climates most residual nitrogen will volatilize. NRCS has useful factors for residual nitrogen and can help with calculations for your region (Bass, 2010).
Due to the potential for leaching and/or volatilization, timing of application is important. “Manure should be applied as close to the crop’s use of the nutrient as possible” (Bass, 2008). For winter grains, application could be done in the early fall. Spring grains, however, should have a manure application in the spring, prior to planting.
Also, manure should be incorporated as soon as possible after application. “Incorporation is necessary to prevent significant volatilization and to maximize nitrogen availability. Incorporation should be done within 1 to 4 days of application and also reduces odors” (Bass, 2008).
To calculate how much nitrogen value a field will receive from manure, simply multiply the total N value of the manure by the application rate. As an example, assume an application rate of 2 T/acre of beef manure with 52% dry matter. From Table 6 we see that each ton contains 21 pounds of total nitrogen. So 2 tons of manure would provide 42 pounds of total nitrogen per acre. Using a conservative estimate that 35% of this nitrogen will be available, the manure will contribute about 15 pounds of nitrogen per acre for the subsequent grain crop.
Sample Calculation:
21 lbs total nitrogen / 1 ton manure x 2 ton manure /ac = 42 lbs nitrogen /ac
42 lbs nitrogen/ac x .35 = 15 lbs nitrogen/ac
There are federal and state regulations dictating proper manure management and application on crop land, though most of these rules are specific to the producer of the manure and land under their control, not second- or third-party users. However, the generalities of the Clean Water Act apply to all, and best management practices (BMPs), such as application timing, incorporation, nutrient budgeting and buffers or setbacks, should be followed for protection of water resources. Farmers who import manure are subject to rules regarding proper storage or stockpiling before application. Manure stockpiles should be managed to prevent leaching or runoff. Note that unmanaged stockpiles can be declared a point-source of pollution by regulatory agencies.
Before determining application rates for your land, contact your local Extension or NRCS office to make sure you are complying with regulations or recommended practices. Be aware that over-application can lead to watershed contamination. In addition, long-term repeated application of manure based on nitrogen balance alone can often lead to excessive phosphorus in the soil. Strict regulations exist on how much manure can be applied, based on soil tests and expected crop uptake. Consult NRCS, Extension or your state Department of Environmental Quality to understand specific regulations for your area.
Further Resources
For more detailed assistance, contact your local Extension agent, NRCS, or visit these helpful websites:
- Manure as a Source of Crop Nutrients and Soil Amendment. 2009. eXtension.
- Oklahoma Soil Test Interpretation and Fertilizer Decision Support Program. Oklahoma State University. Includes an animal manure value calculator.
- Value of Animal Waste Calculator. Oklahoma State University.
- Alabama Nutrient Contents of Fertilizer Materials. ANR-174. 2008. Charles C. Mitchell, Alabama Cooperative Extension.
- Animal Waste/Manure Economics, William Lazarus. University of Minnesota.
Sodium Nitrate
Sodium nitrate, or Chilean nitrate, is a mined source of nitrogen that is allowed with restrictions for organic crop production. While it is a natural mined substance, it is a salt with high solubility; consequently, there are restrictions on its use. The NOP regulations state that sodium nitrate “use is restricted to no more than 20% of the crop’s total nitrogen requirement…”(NOP, 2010; emphasis added).
A sample calculation shows how this might work. Assume you grow organic wheat in Montana with a normal yield of 50 bu/acre. From the “Fertilizer Guidelines for Montana Crops” in Table 1 (Jacobsen et al., 2005), you know that the total nitrogen requirement for this crop is 104 lbs N/acre. Therefore, the nitrogen gained from sodium nitrate cannot exceed roughly 20 lbs/acre.
Sample Calculation
104 lbs N/acre x .20 = 20.8 lbs N/acre
The chemical formula of sodium nitrate is NaNO3. Because the chemical composition of sodium nitrate is only about 16% nitrogen, the application rate for this crop could be as high as 130 lbs/acre.
20.8 lbs N/acre = 130 lbs Na NO3 /acre
.16 lb N/lb of NaNO3
Phosphorous
Phosphorus (P) is the next-most-essential element for plant growth. Phosphorus is essential for the energy transfer system of a plant and is important in photosynthesis and respiration (Gilmour, 2009). Plants take up phosphorus in the form of the phosphate ions (H2PO4-, and HPO4-2) Unlike nitrate ions, phosphate ions bind strongly to positive ions in the soil, such as calcium, making P much less available to plants than N.

Figure 1. The Availability of Phosphorous is Affected by Soil pH. Adapted from Busman, L. et al., 2002. The Nature of Phosphorous in Soils.
Phosphorus is often the most-limiting nutrient in an organic grain system, and even more difficult to manage in a non-ideal pH situation. It is sometimes called the “reluctant nutrient” because it is very immobile in the soil.
Phosphorus is most available in soils with a pH of 6.5. At pH less than 6.5 (slightly acidic), phosphorus tends to bind with aluminum and iron oxides and hydroxides. In soils with pH greater than 6.5 (slightly alkaline), phosphorus tends to form calcium precipitates. It is important to recognize that even when phosphorus is present in the soil, it may not be readily available to plants.
In addition, while farmers can “grow” organic nitrogen with green manure, this unfortunately is not possible with phosphorus. To replenish phosphorus in the soil and maintain a balanced nutrient budget, it must be added back to the system in the form of manure or another organic fertilizer. Availability of P can be altered in the short term, but again, there is only a finite amount of P in the soil.
Calculating Phosphorus Needs
Regular soil testing is critical for successful management of phosphorus in an organic system. Not only is it important to know the phosphorus level in your soil, it is important to understand soil pH levels, since this will determine the amount of phosphorus available for plant use.
Phosphorus Soil Tests
There are several different soil tests for phosphorus, and it is important to know which one is appropriate for your soil. In soils with pH 7.0 or above, the Olsen test is recommended. In soils with pH below 7.0, the Bray or Mehlich tests are recommended. The resulting values from these tests are not equivalent to each other, and there is no reliable conversion factor between the two (Jones and Jacobsen, 2005). If shipping samples out of state, make sure the lab is using a test calibrated for your area’s soils.
The critical soil phosphorus level for grain production is around 16 ppm (Olsen) and 20 ppm (Bray or Mehlich). Ideally, your soil should be above these levels to have some phosphorus “in the bank” (Jones, 2010).
| Table 7. Phosphorus Sufficiency Levels for Wheat and Alfalfa, Iowa | ||
| Bray P1 or Mehlich-3 P | Olsen P | |
| Wheat or Alfalfa | Wheat or Alfalfa | |
| Relative Level | ppm | ppm |
| Very Low | 0 -15 | 0 – 10 |
| Low | 16 – 20 | 11 – 14 |
| Optimum | 21 – 25 | 15 – 17 |
| High | 26 – 30 | 18 – 20 |
| Very High | 31+ | 21+ |
| Source: A General Guide for Crop Nutrient and Limestone Recommendations in Iowa. J.E Sawyer et al. 2008. Iowa State University Extension PM 1688. | ||
The chance of reduced yield increases when phosphorus drops below the critical level. Visual symptoms of phosphorus deficiency generally aren’t evident until soil is well below the critical level. These symptoms include dark green or purplish leaves, with tip death in some cases. Reduced tillering and delayed maturity are also symptoms of phosphorus deficiency in small grains (Montana IPM Center, 1998). If you suspect low phosphorus in your existing crop, you can have a tissue analysis test done. Most Extension universities can perform this test for you. Contact your local Extension agent for more information.
Further Resources
For more information on the link between yield and P level, visit the Montana State University Extension Service’s Nutrient Management Module 4, “Phosphorus Cycling, Testing, and Fertilizer Recommendations.”
In the Northern Great Plains, some farmers have been growing organic grains for 20 to 25 years. Most of these farmers have not added any phosphorus during this time, and are just beginning to see some effects of low-phosphorus soils. One reason for this lag time in the appearance of phosphorus deficiency may be the previous generation’s fertilizer applications. If the previous generation applied phosphorus fertilizer regularly, that phosphorus would still be available for the next generation’s crops. Dr. Clain Jones, Extension soil fertility specialist at Montana State University, estimates there are about 100 years of available phosphorus in Montana soils. (This number will vary, depending on location.) Deficiency symptoms will occur long before this time, however; probably at the 5- to 30-year mark depending on soil test levels of P. The issue of phosphorus fertility in organic crop production is just starting to be a larger concern, as existing soil reserves are drawn down.
Phosphorus Removal Rates
To estimate phosphorus needs, consult a table of nutrient removal rates for your area. In Montana, for example, referring to the state’s crop removal rates in Table 1, assume a crop of 50 bu/acre of winter wheat is grown. In Montana, this wheat crop will remove 31 lbs/acre of P2O5 in the grain and an additional 9 lbs/acre of P2O5 in the straw. (See the sample calculation for straw production in the Nitrogen section to estimate the straw produced.) Therefore, the total P2O5 requirement to grow this crop is about 40 lbs/acre.
General Conversion Factors for Fertilizer Values
While nitrogen fertilizer requirements are expressed as simple N, phosphorus and potassium are expressed in their oxide forms (P2O5 and K2O). Switching between the elemental and oxide forms requires use of a conversion factor.
• 1 lb P2O5 x 0.44 = 1 lb P
• 1 lb P x 2.29 = 1 lb P2O5
• 1 lb K2O x 0.83 = 1 lb K
• 1 lb K x 1.2 = 1 lb K2O
(Gilmour, 2009)
Animal Manure
A good source of phosphorus for organic crop production is animal manure. Not only does the manure provide other macronutrients and micronutrients, but it also contains organic matter, which helps to build soil health. In addition, the phosphorus in manure is very plant-available, due to its chemical properties.
The PUE Value
PUE stands for Phosphorus Use Efficiency and is essentially the percentage of applied P fertilizer that is taken up by the crop. This number will vary depending on the specific soil type and the type of phosphorus applied. In general, as calcium carbonate (CaCO3), or lime content, of the soil increases, the PUE decreases (Jones, 2010). Also, inorganic sources of P tend to have lower PUE values than organic sources. PUE values have been found to range from about 30% to 85% for manures, depending on soil and type of manure (Eghball et al., 2005; Eghball and Power, 1999). Soils with pH levels above 7.5 or below 5.5 will have lower efficiencies and require more manure to meet crop P needs. When determining appropriate manure application rates you will need to use the PUE value in the calculation. Contact your local Cooperative Extension agent or a Certified Crop Advisor (CCA) to determine the correct PUE value for your location.
While all manures provide some phosphorus, poultry manure provides the most, with an average analysis of 48 lbs P2O5 /ton. (Refer to Table 6.) Assuming you needed 40 lbs of P2O5 per acre for this winter wheat crop, you would need to apply about 1.67 tons of poultry manure per acre, if the PUE is 50%.
Sample Calculation
40 lbs P2O5 per acre / 48 lbs P2O5 per ton manure = .83 tons manure / acre
.83 tons manure / .50 (PUE) = 1.67 ton manure / acre
When applying manure, there is always the risk of runoff and water pollution. Proper timing and incorporation of the manure are essential to good management practices. State Cooperative Extension offices provide a wide range of services related to the proper application of manure, and can be a great source of information on this topic. Also, NRCS offices have programs that assist with farmstead conservation planning and can provide incentives for implementing conservation practices such as manure application, nutrient management and cover crops.
Livestock Integration
Long-term sustainability of an organic grain system may require the integration of a livestock component for adequate nutrient application. One idea is to link organic grain farmers with local livestock producers for a source of manure. Transportation may be the limiting factor for this idea, especially in the West, where distances between farms can be quite large.
Further Resource
If you are in the North-Central Region, you may want to visit the University of Illinois Extension Manure Share. This website acts as a networking site for farmers to exchange manure.
Bone Meal (4-14-0)
Another potential source of organic phosphorus is bone meal. Bone meal is a by-product of the meat packing industry and is available at various locations across the United States. Compared with manure, bone meal’s phosphorus is not as plant-available and it can be expensive. Analysis of bone meal shows an average P2O5 content of around 14%, but this number can change depending on the source of the bone meal.
Bone Meal Calculation
To calculate how much bone meal to apply to provide 40 lbs P2O5/ acre, use the following equation:
40 lbs P2O5 / acre required = 286 lbs/acre of bone meal
14 lbs P2O5 / 100 lbs bone meal
Finding Organic Phosphorus Suppliers
OMRI, the Organic Materials Review Institute, is a great resource for finding organic fertilizer companies. You can order the OMRI Products List from them by calling 541-343-7600. Or you can view it online here.
Rock Phosphate (0-3-0)
Rock phosphate is another source of phosphorus allowed in organic production. It is a mineral mined from deposits in the earth. “Phosphate rock minerals are the only significant global resources of phosphorus” (Jasinski, 2006). In the United States, phosphate-containing rock is mined in Florida, Idaho, North Carolina, and Utah. Rock phosphate can be purchased in either pelletized or finely ground (reactive rock phosphate) forms. The difficulty with rock phosphate is its low plant-available phosphorus and comparatively high cost. Rock phosphate has only about 3% available P2O5.
Consider the example crop of winter wheat with a yield potential of 50 bu/acre and a P2O5 requirement of 40 lbs/acre.. Use the following calculations to decide how much rock phosphate to apply per acre.
Sample Rock Phosphate Calculation
40 lbs P2O5 / acre required = 1,333 lbs/acre of rock phosphate
3 lbs P2O5 / 100 lbs rock phosphateTherefore, the farmer would need to apply 1,333 lbs/acre of rock phosphate to meet the complete P2O5 requirement for this crop of wheat.
Test a Small Patch
Be aware that these phosphorus requirement figures are all estimates. It is difficult to exactly estimate the correct amount of phosphorus for a specific crop because crop responses are not always consistent. If your soils test low for phosphorus, you are more likely to see a response to phosphorus fertilizer than if your soils test high (Jones and Jacobsen, 2005). Sometimes trial and error is the best way to fine-tune the phosphorus needs on your own farm. Try some phosphorus fertilizer on a few acres and see if there’s a yield difference before you apply it everywhere, especially if you are considering mineral options, which are often expensive.
Farmer Feedback
Rick Winkowitsch and his wife Kim farm 2,400 acres of organic small grains and legumes near Cut Bank, Montana. Rick uses rock phosphate for P fertility, and finds that the best way to apply it is to band it in the root zone when seeding a legume crop. He believes the acidity of the legume helps to break down the rock phosphate. He applies 100 to 120 lbs/acre with the legume, and then another 100 to 120 lbs/acre again in the fall when seeding winter wheat.
Rick applies rock phosphate about six out of every 10 years, but says that his application frequency depends on his production levels. If he produces a big crop, he makes sure to apply rock phosphate to replace the nutrients. However, if there is a drought year or the crop is hailed out, he will not apply rock phosphate the following year.
Rick does say that there can be a time lag in the effectiveness of rock phosphate. It needs time to break down into a form that plants can use. The amount of time will depend on moisture and overall soil health. As a result, the yield benefit doesn’t always show up right after the rock phosphate application.
Organic Matter
Organic matter will also release some phosphorus as it mineralizes (Brady, 1990). From the previous example of soil organic matter and its contribution to nitrogen availability, remember that 1% soil organic matter contains about 100 lbs of phosphorus. As this mineralizes, it will release 4 to 6 lbs of P2O5 per acre per year.
While these numbers are estimates and will depend on the rate of mineralization, it is safe to assume there is some small addition of phosphorus from soil organic matter. However, unlike nitrogen, this phosphorus is not added from outside the system through legume fixation and consequently does not contribute to the nutrient budget balance unless it is brought to the field from another location.
Cover Crops
Many organic farmers use cover crops to make phosphorus more available in the soil. Crops such as buckwheat and legumes can acidify the root zone. In alkaline soil conditions, this can help to release phosphorus that is bound to calcium (Zhu et al., 2002).
There is debate, however, whether or not this phosphorus would then be more available to a following cash crop of small grains. More research is needed to further understand the interaction between cover crops and phosphorus availability to the crop in the following year.
Whether or not cover crops make phosphorus available, it still remains that cover crops do not add additional phosphorus to the system. Nitrogen-fixing legumes take nitrogen from the atmosphere and make it available to the plants, but there is no similar action for phosphorus. Over time, even the potential phosphorus released by cover crops will need to be replaced to balance the nutrient budget.
Further Resources
The International Plant Nutrition Institute hosts a presentation on Phosphorus Nutrition of Wheat on their website. Click on “Phosphorus,” then “Phosphorus Nutrition PowerPoint Series.”
Increasing Soil pH
When considering phosphorus application, note that you may need to adjust your soil pH to make the existing phosphorus more available. If you have acidic soil you should be aware that many liming agents qualify as organic soil amendments. Table 8 lists the most common liming agents along with their organic amendment status.
| Table 8: Sources of Organic Liming Agents | ||||
| Source | Physical Form | Chemical Formula | Analysis | Allowed as Organic Amendment? |
| Calcitic lime | solid | CaCO3 | 40% Ca | Yes |
| Dolomitic lime | solid | CaMg(CO3)2 | 22% Ca, 13% Mg | Yes – mined |
| No – slaked or fired | ||||
| Gypsum | solid | CaSO4.2H2O | 23% Ca | Yes – only mined forms |
| Potassium Magnesium sulfate | solid | K2SO4.2MgSO4 | 11% Mg | Yes – only mined forms |
| Sources: Gilmour, J. 2009. Preparing for the 2009 International Certified Crop Adviser Exam. International Plant Nutrition Institute; OMRI Standards Manual. 2009. Organic Materials Review Institute. | ||||
Check with your certifier to ensure the lime you intend to use is compliant with organic standards. According to the OMRI Standards Manual, mined minerals are allowed, but a material “must not have undergone any change in its molecular structure through heating or combining with other substances.” Furthermore, mined materials are “acceptable if the material is not processed or fortified with synthetic chemicals” (Organic Materials Review Institute, 2009). For example, mined dolomite is allowed as an organic soil amendment, but slaked or fired dolomite is not. For application rates and recommendations, check with your local Extension service or NRCS.
Decreasing Soil pH
Another means of increasing phosphorus availability is lowering the pH of alkaline soils. Unfortunately, while there are ways to make small reductions in pH level, not much can be done to decrease the pH of calcareous soils significantly. The main factor driving this will be the amount of calcium carbonate (CaCO3) in the soil. If the calcium carbonate level is lower than about .01%, manure and compost will probably decrease the pH with their acidity. However, if the calcium carbonate level is 10% or more, it would take excessive, unrealistic volumes of inputs to neutralize (Jones, 2010).
In general, composts and manures tend to be acidic, which would help to release more phosphorus in an alkaline soil. However, never assume that manure is acidic. Some manures can be alkaline if the livestock feed was primarily alkaline (McCauley et al., 2009). Make sure you have a full nutrient analysis—including a pH analysis—of the manure before using it.
Elemental sulfur, an approved organic amendment, has sometimes been used to decrease soil pH. However, its effectiveness can be minimal. A recent study discovered that at a pH of 8, with 1.5% calcium carbonate present, when 1000 lbs of elemental sulfur were applied per acre, the pH only lowered to 7.8. Similarly, when 10,000 lbs of elemental sulfur per acre were applied to the same soil, the pH only lowered to 7.5. Applying elemental sulfur can be an expensive, yet relatively ineffective, method of decreasing soil pH (Agvise Laboratories, 2010).
Potassium
The third-most important macronutrient is potassium (K). Potassium is important for stem growth, regulating water loss, and is involved in nitrogen and carbohydrate metabolism (Gilmour, 2009). In general, “Crop requirements for potassium are high, three to five times [those] of phosphorus, and equal to [those] of nitrogen” (Brady, 1990). In addition, plants have the capacity to take up too much potassium. This is known as luxury consumption. For this reason, and because potassium can leach through the soil profile, frequent, light applications of potassium are recommended rather than heavy, less frequent applications (Brady 1990).
Potassium Removal Rates
From the nutrient removal rates in Table 1, we see that a 50 bu/acre crop of winter wheat in Montana will remove 19 lbs of K2O/acre in the grain as well as about 62 lbs of K2O/acre in the straw. This crop, then, requires about 81 lbs of K2O/acre to completely replace the amount of K removed.
Soil Test Levels for Potassium
Besides calculating removal rates, a soil test is another way to determine potassium needs. As an example, the following chart gives potassium sufficiency amounts for wheat in Kansas. Check with your state land grant university for recommendations for your area.
| Table 9. Potassium Sufficiency Recommendations for Wheat (Kansas State University) | |||||
| Yield Goal (Bu/acre) | |||||
| Exch. K (ppm) | 30 | 40 | 50 | 60 | 70 |
| Lbs K2O/acre | |||||
| 0-40 | 60 | 60 | 65 | 65 | 65 |
| 40-80 | 35 | 40 | 40 | 40 | 40 |
| 80-120 | 15 | 15 | 15 | 20 | 20 |
| 120-130 | 15 | 15 | 15 | 15 | 15 |
| 130+ | 0 | 0 | 0 | 0 | 0 |
| Crop Removal | 9 | 12 | 15 | 18 | 21 |
| Source: Leikam, D.F., et al. 2003. Soil Test Interpretations and Fertilizer Recommendations. | |||||
Excess Potassium
Soils often have K2O levels above the 300 ppm level. This excess amount does not pose a problem until about 700 to 800 ppm, at which point it may begin to interfere with uptake of other important nutrients (Dinkins and Jones, 2007).
Animal Manure
Animal manure is a source of potassium for organic crop production. About half of the potassium originates in the liquid fraction of manure. The liquid and solid manure fractions are often mixed together in open-lot cattle systems where animal waste is all left in the lot prior to scraping/cleaning. By contrast, some highly engineered waste systems in swine and dairy production separate liquid and solid wastes, which divides the available nutrients. Manure managers looking to maximize potassium content should be careful to conserve the liquid urine fraction within the manure.
About half of the potassium applied from manure will be available to the following cash crop (Brady, 1990). To calculate manure application rates for purposes of potassium addition, we will use dried beef manure as an example. From Table 6, we see that this manure contains about 23 lbs of K2O per ton.
Manure Application for Potassium Requirements
To calculate an application rate of 81 lbs K2O per acre, we would use the following equation:
81 lbs K2O per acre / 23 lbs K2O per ton manure = 3.52 tons manure per acre
3.52 tons / .5 (availability rate) = 7.04 tons manure per acreRemember that this application rate assumes full replacement value, which accounts for the high rate of application.
Muriate of Potash (KCl) 0 – 0 – 60
Muriate of potash is the most common source of mineral potassium in conventional, non-organic crop production. In North America, muriate of potash (KCl) accounts for approximately 95 percent of all potash fertilizers (International Plant Nutrition Institute, 1998). Most of the KCl used in North America comes from mines in Saskatchewan, Canada.
KCl is considered to be a mined substance with high solubility; therefore, organic regulations allow for its use, but with restrictions. Specifically, “muriate of potash (potassium chloride) must be applied in a manner that minimizes chloride accumulation in the soil” (OMRI, 2009).
The accumulation of chloride may be an issue for soils prone to salinity. A common way to check for salt accumulation is by measuring electrical conductivity (EC). In general, soils that have an EC value greater than 4 mmhos/cm will require some type of remediation, such as irrigation flushing, and should not have KCl applied (Brady, 1990). Since potassium chloride has some restrictions, check with your certifier before applying. Your certifier may require a soil test to document the need for K application, as well as the lack of chloride accumulation, prior to using KCl.
Potassium Chloride Calculation
To calculate for the crop removal rate of 81 lbs K2O /acre:
81 lbs K2O /acre needed = 135 lbs KCl fertilizer/ acre
60 lbs K2O / 100 lbs KCl fertilizer
Potassium Sulfate (0 – 0 – 50 – 18)
Another source of mineral potassium is potassium sulfate, also called sulfate of potash (SOP). The chemical formula for SOP is K2SO4. The organic regulations consider potassium sulfate to be a mined substance of low solubility, and it is therefore allowed for use in organic systems without restrictions (Gilmour, 2009).
SOP is mined from the Great Salt Lake by evaporating the water in separating pools and collecting the remaining minerals. One advantage of SOP is that it contains no chloride. If your soils are prone to salinity, this may be the best mineral potassium fertilizer choice. In addition, SOP contains sulfur, another essential element for plant growth. Typically, the sulfur content per 100 lbs of SOP analyzes at 18%.
Potassium Sulfate Calculation
The calculation for using SOP, assuming you need the full value of 81 lbs/acre, is as follows:
81 lbs K2O /acre needed = 76 lbs K2SO4 fertilizer/ acre
50 lbs K2O / 100 lbs fertilizer
Sulfate of Potash Magnesia (0–0–22–23)
Sulfate of potash magnesia (2MgSO4 o K2SO4 ), also referred to as Sul-Po-Mag, is a natural mineral salt. Sul-Po-Mag typically contains 20 to 22 percent potash and sulfur and 10 to 11 percent magnesium (Stewart, 2001). Organic regulations consider this to be a mined substance of low solubility, and it is allowed for use without restrictions (OMRI, 2009).
Sul-Po-Mag Calculation
The calculation for using sulfate of potash magnesia, assuming you need the full value of 81 lbs K2O /acre, is as follows:
81 lbs K2O /acre needed = 368 lbs Sul-Po-Mag fertilizer/ acre
22 lbs K2O / 100 lbs fertilizer
Calcium, Magnesium, and Sulfur
Calcium (Ca), magnesium (Mg), and sulfur (S) are the final macronutrients necessary for healthy plant growth. According to the nutrient removal rates for Montana crops (Table 1), one bushel of wheat—along with the straw—removes about 4.6 lbs of calcium, 2.3 lbs of magnesium, and 3.8 lbs of sulfur. Consequently a 50 bu/acre crop of winter wheat will remove about 230 lbs of calcium per acre, 115 lbs of magnesium per acre, and 190 lbs of sulfur per acre.
Table 10 summarizes the most common sources of calcium, magnesium, and sulfur allowed for organic crop production. To calculate application rates, consult a crop removal rate table for your area, or use a soil test to determine current soil macronutrient levels.
| Table 10. Sources of Organic Calcium, Magnesium, and Sulfur | ||||
| Source | Physical Form | Chemical Formula | Analysis | Allowed as Organic Amendment? |
| Calcitic lime | solid | CaCO3 | 40% Ca | Yes |
| Dolomitic lime | solid | CaMg(CO3)2 | 22% Ca, 13% Mg | Yes – mined |
| No – slaked or fired | ||||
| Gypsum | solid | CaSO4.2H2O | 23% Ca | Yes – only mined forms |
| Potassium Magnesium Sulfate | solid | K2SO4.2MgSO4 | 11% Mg, 23% S | Yes – only mined forms |
| Elemental sulfur | solid | S | 90% S | Yes – this is an allowed synthetic. No restrictions for crop fertility. |
| Sources: Gilmour, J. 2009. Preparing for the 2009 International Certified Crop Adviser Exam. International Plant Nutrition Institute. p. 16 and Organic Materials Review Institute. 2009. OMRI Standards Manual. | ||||
Micronutrients
For the sake of brevity, this publication only addresses the six most essential macronutrients: nitrogen, phosphorus, potassium, calcium, magnesium, and sulfur. However, there are also eight micronutrients necessary for grain crop growth: chlorine, copper, iron, manganese, molybdenum, nickel, and zinc.
While micronutrient deficiencies can occur, they are not common in the Northern Great Plains (Jacobsen et al., 2005). Regular soil testing can identify a problem before it affects yields, and should be used in areas with suspected micronutrient deficiencies.
For information on organic sources of micronutrients, OMRI provides a comprehensive catalog and website of allowed substances at www.omri.org. You can also order a hard-copy catalog by calling OMRI at 541-343-7600.
Conclusion
Maintaining adequate soil fertility is important for healthy organic crops. Over time, crops remove nutrients from the soil. These nutrients must be replaced to balance the nutrient budget.
In an organic system, these nutrients should come from local, biological sources as often as possible. Biological sources such as cover crops and livestock manure add organic matter along with nutrients. Organic matter also benefits the soil biology. Using local sources saves fuel and cost due to shipping. Organic grain farmers may need to consider livestock integration, or partnering with neighbors who own livestock, to provide access to livestock manure.
If biological sources are in short supply, mined sources of organic fertilizer, such as rock phosphate, can be used. Always check with your certifier before using a new substance, to insure it is acceptable.
Rely on regular soil testing, a local crop-removal-rate table, and personal experience to calculate crop needs each year. Because nitrogen levels are so variable, annual soil tests immediately prior to planting are recommended. Other nutrients, such as phosphorus, are more stable and require less frequent testing.
Test for organic matter every five years or so to monitor levels. Organic standards require that soil organic matter levels remain constant or increase over time. Soil testing is a reliable way to measure any progress.
Base nutrient budget calculations on local information. The nitrogen contribution of green manures will depend on local climate and variety selection. Crop removal rates will vary by location. Check with local Extension or NRCS to receive accurate local information before making calculations.
Think about sustainability when making fertility choices. Organic farming is not simply the act of substituting an organic fertilizer for a conventional one. Treat the fertility plan as one piece of a complex biological system that requires management and care.
Case Study Example
An organic farmer in South Dakota is trying to design a rotation for adequate nitrogen fertility for an organic corn crop. The cash crops on this operation are corn, soybean, and wheat. Additional fertility is provided by dried beef manure applied at 2 tons per acre. Soil organic matter levels average 3.5% across all fields.
The current rotation is as follows:
• Corn
• Oat and berseem clover
• Soybean
• Wheat and berseem clover
Nitrogen contributions vary according to region and climate. An estimate of nitrogen credits from various cover crops in South Dakota is given in Table 11.
Table 11. Nitrogen Credits from Previous Crops, South Dakota
| Crop | Population
(Plants/ft2) |
N Credit
(lbs N/acre) |
| Alfalfa or legume green manure | < 1 | 0 |
| 1 – 2 | 50 | |
| 3 – 5 | 100 | |
| > 5 | 150 | |
| Soybeans, edible beans, peas, lentils, and other annual legumes | 40 |
Source: Best Management Practices for Corn in South Dakota. 2009. South Dakota State University Extension. EC929.
This specific rotation contributes the following amount of nitrogen during each crop year.
| Table 12. Amount of N Contributed to the Soil by Each Crop | |
| Rotation | N Credit |
| (Lbs/acre) | |
| corn | 0 |
| oat/berseem clover | 40 |
| soybean | 40 |
| wheat/berseem clover | 40 |
Corn is the heaviest N feeder in this rotation, with a requirement of about 160 lbs/acre in South Dakota (Clay, 2010). Therefore the heaviest N contribution must be made prior to seeding the corn crop. If we look at only the time from wheat/berseem to corn, this rotation will be nitrogen deficient by the following calculations, shown in Table 13:
| Table 13. Calculation of N Budget for Organic Corn Crop | |||||||||
| 1. Soil Organic Matter N Contribution | |||||||||
| If not known, estimate 10-15 lbs N/acre | 3.5 x 12 | + | 42 | ||||||
| for each 1% soil organic matter | |||||||||
| 2. Manure and Compost N Contribution | |||||||||
| Manure contribution | |||||||||
| 2T dry beef manure | x | 21 lbs/N/ton of manure | 0.33* | + | 13.86 | ||||
| 1 acre | 1 T manure | ||||||||
| Compost contribution | 0 | ||||||||
| wheat/berseem clover | + | 40 | |||||||
| 3. Cover Crop N Contribution | |||||||||
| wheat/berseem clover | + | 40 | |||||||
| 4. Crop Needs | |||||||||
| Corn | – | 160 | |||||||
| Deficit or Surplus | -64.14 | ||||||||
To add enough N to this crop rotation, alfalfa should be added to the rotation immediately prior to corn. Increasing the manure application to 3 tons per acre also helps to balance the N budget for this rotation.
| Table 14. Adjusted N Budget with Alfalfa | ||||||||
| 1. Soil Organic Matter N Contribution | ||||||||
| If not known, estimate 10-15 lbs N/acre | 3.5 x 12 | + | 42 | |||||
| for each 1% soil organic matter | ||||||||
| 2. Manure and Compost N Contribution | ||||||||
| Manure contribution* | ||||||||
| 3T dry beef manure | x | 21 lbs/N | x | 0.33* | + | 20.79 | ||
| 1 acre | 1 T manure | |||||||
| Compost contribution | 0 | |||||||
| 3. Green Manure Contribution | ||||||||
| Alfalfa | + | 100 | ||||||
| Total N Credits | + | 162.79 | ||||||
| 4. Crop Needs | ||||||||
| Corn | – | 160 | ||||||
| Deficit or Surplus | 2.79 | |||||||
| *Ratio for manure contribution from “Using Manure Analysis Results.” South Dakota Department of Environment and Natural Resources. 2003. | ||||||||
References
Agvise Laboratories website. 2010. “High Soil pH – Can We Fix This Problem?”
Bass, T. 2008. Using Manure as Fertilizer. Montana State University Extension. EB 0184.
Bass, Thomas. Montana State University Extension. 2010. Personal communication.
Blackshaw, R. E. 2005. Nitrogen fertilizer, manure, and compost effects on weed growth and competition with spring wheat. Agronomy Journal. Vol. 97. p. 1612-1621.
Brady, N. C. 1990. The Nature and Properties of Soils, 10th edition. Macmillan. New York. 621 p.
Clark, Andy (ed.) 2007. Managing Cover Crops Profitably, 3rd ed. Sustainable Agriculture Network. 244 p.
Clay, David. South Dakota State University. 2010. Personal communication.
Dinkins, C.P. and C. Jones. 2007. Interpretation of Soil Test Results for Agriculture. Montana State University Extension. MT200702AG.
Eghball, Bahman, Brian J. Wienhold, Bryan L. Woodbury, and Roger A. Eigenberg. 2005. Plant Availability of Phosphorus in Swine Slurry and Cattle Feedlot Manure. Agronomy Journal. Vol. 97. p. 42–548.
Eghball, Bahman, and James F. Power. 1999. Phosphorus- and Nitrogen-Based Manure and Compost Applications: Corn Production and Soil Phosphorus. Soil Science Society of America Journal. Vol. 63. p. 895–901.
Engel, R. G. Carlson, D. Long, 1999. Post-Harvest Evaluation of N Management for Spring Wheat Using Grain Protein. Montana State University. Fertilizer Facts No. 21.
Gilmour, J. 2009. Preparing for the 2009 International Certified Crop Adviser Exam. International Plant Nutrition Institute. 175 p.
International Plant Nutrition Institute. 1998. “Production and Use of Potassium.” Better Crops with Plant Food. Vol. 82, No. 3.
Jasinski, S.M. 2006. Phosphate Rock. 2006 Minerals Survey. U.S. Department of the Interior. U.S Geological Survey.
Jacobsen, J., Jackson, G., and Jones, C. 2005. Fertilizer Guidelines for Montana Crops. Montana State University Extension Service. EB161.
Jones, Dr. Clain. 2010. Personal conversation.
Jones, C., and J. Jacobsen. 2005. Phosphorus Cycling, Testing and Fertilizer Recommendations. Nutrient Management Module No. 4. Montana State University Extension.
Leikam, D.F, R.E. Lamond, and D. B. Mengel. 2003. Soil Test Interpretaions and Fertilizer Recommendations. Kansas State University. MF-2586.
Livestock Waste Facilities Handbook. Third Edition. 1993. MidWest Plan Service. Table 10-6. pg. 10.4.
McCauley, A., C. Jones, J. Jacobsen. 2009. Soil pH and Organic Matter. Nutrient Management Module 8. Montana State University Extension.
Montana IPM Center. 1998. Wheat Diseases in Montana website. “Abiotic Diseases: Nutritional. Phosphorus Deficiency.”
National Organic Program Regulations. 2010. CFR7 §205.203 (c). Soil Fertility and Crop Nutrient Management Practice Standard, Manure Rule.
National Organic Program Regulations. 2010. CFR7 §205.602 (g). Nonsynthetic Substances Prohibited for Use in Organic Crop Production.
Organic Materials Review Institute. 2009. OMRI Standards Manual.
Stewart, Dr. W.M. 2001. Potash Terminology and Facts. Agri-Briefs. International Plant Nutrition Institute. Winter 2001, Number 7.
USDA – NRCS. 1987. Potential for Phosphorus Available from Animal Manure to Meet or Exceed Plant Uptake and Removal on Non-legume Harvested Cropland, and Hayland, and Pastureland.
Zentner, R.P., C.A. Campbell, V.O. Biederbeck, F. Selles, R. Lemke, P.G. Jefferson and Y. Gan. 2004. Long-term assessment of management of an annual legume green manure crop for fallow replacement in the Brown soil zone. Canadian Journal of Plant Science. Vol. 84. p. 11-22.
Zhu, Y-G, Y-Q He, S.E. Smith, F.A. Smith. 2002. Buckwheat Has High Capacity to Take Up Phosphorus (P) from a Calcium (Ca)-bound Source. Plant and Soil. Vol. 239. p. 1-8.
Nutrient Management in Organic Small Grains
Susan Tallman, CCA
NCAT Agronomist
Published January 2012
© NCAT
IP391
Slot 387
This publication is produced by the National Center for Appropriate Technology through the ATTRA Sustainable Agriculture program, under a cooperative agreement with USDA Rural Development. ATTRA.NCAT.ORG.
Special thanks to Dr. Clain Jones and Kathrin Olson, Montana State University, for in-depth information and editing.