High Tunnel Winter Growing Using Heat Recovery Ventilation
By Chris Lent, NCAT Agriculture Specialist
Abstract
Controlling humidity and temperature in high tunnels during the winter is challenging for farmers. This publication describes a trial of a heat recovery ventilation (HRV) system as an alternative to traditional open-air ventilation in winter high tunnel production. The project was funded by a Northeast Sustainable Agriculture Research and Education (NESARE) Partnership Grant to the National Center for Appropriate Technology (NCAT), in collaboration with New Morning Farm. This publication describes the installation of the heat recovery equipment and provides an analysis of data on humidity and temperature in the winter growing tunnels used in the project. Harvest records from the 2015-2016 winter growing season and energy usage data were used to determine what impact, if any, the ventilation system had on profitability of the winter-grown crops.
Contents
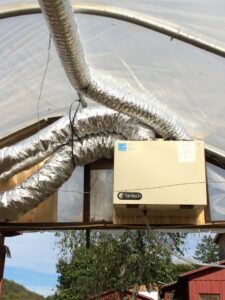
The 106-CFM Fantech heat recovery ventilator installed in the gable of the lower high tunnel at New Morning Farm. Photo: Chris Lent, NCAT
Introduction
What is a Heat Recovery Ventilator?
Sizing the HRV
Installation
Project Description and Analysis
Crops
Energy Use
Conclusions, Observations, and Recommendations
References
Introduction
Growers in the Northeast who use high tunnels to grow crops throughout the winter face the challenges of low temperatures and high humidity conditions. Humidity control through ventilation is seen by most prominent winter growers in the Northeast as the most important practice for controlling foliar diseases in winter crops, even if it means lowering temperatures in the greenhouse (Hartman, 2014). At the same time, it is known that average daily temperatures greatly affect the growth rate of crops.
The pilot project highlighted in this publication proposed to test whether or not the use of a heat recovery ventilator could effectively increase the average daily temperature in a high tunnel and, as a result, increase crop production and profitability. NCAT worked with New Morning Farm, a certified organic farm with experience in winter production, to test the use of this nontraditional ventilation system. Two high tunnels of the same size were used in the project. One tunnel was used to test the capabilities of the heat exchanger, and the other tunnel as a control. This publication describes the installation process and the results of the winter-long project.
New Morning Farm, a 95-acre certified-organic vegetable farm in Hustontown, in south-central Pennsylvania, is owned and operated by Jim and Moie Kimball Crawford. The Crawfords have farmed organically for more than 40 years and, from the start, all produce has been direct-marketed in Washington, D.C. New Morning Farm produces approximately 60 different crops, all certified organic. Crops include berries and herbs in addition to most standard garden vegetables. The farm employs six to eight year-round helpers and approximately 25 seasonal workers and apprentices.
What is a Heat Recovery Ventilator?
Figure 1. This image shows the air flow and heat transfer that takes place in a heat recovery ventilation unit. Image: www.venmar.ca/home.html.
Heat recovery ventilators (HRV), also known as air-to-air heat exchangers, are a tested, relatively low-cost, energy-efficient technology that uses fans to exchange inside air with outside air in cold climates. Heat is transferred from the warm outgoing air to the cold incoming air via an aluminum heat exchanger, thus effectively ventilating a space without significantly lowering the temperature and subsequently wasting the energy that was used to heat that space.
Ventilation systems like this have been used for decades in people’s homes to control moisture without losing heat from the home. They are made in different sizes, usually measured in cubic feet per minute (CFM), which indicates the volume of air that a unit can exchange in a given amount of time. The HRV unit chosen for this project was a Fantech model 100H, which is rated at 106 CFM.
Sizing the HR
Sizing the ventilator for this project was a guessing game. For summertime high tunnel ventilation, when temperature control is a main focus, it is recommended to design ventilation that is capable of changing the entire volume of air in the tunnel every minute. That can maintain the inside temperature at only eight degrees above the outside temperature (Cooperative Extension, 2014). For winter growing, on the other hand, fewer air changes are needed because moisture control is the main concern. For this project, a good, but a bit arbitrary, starting point seemed to be one-half air change per hour. At this rate, the full volume of air in the tunnel would be exchanged with outside air 12 times in the period of one day.
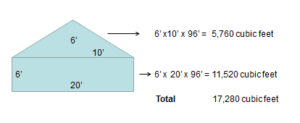
Figure 2
In order to choose a ventilator size then, the air volume of the high tunnel needs to be determined. To determine the volume, it’s easier to figure the volume of the base and peak areas separately and then add them together. The Gothic-style tunnels in this project were 20 feet wide by 96 feet long by 12 feet at the peak, so to find the volume of the top triangular section you multiply 6 feet by 10 feet by 96 feet to get 5,760 cubic feet. The volume of the lower section is 6 feet by 20 feet by 96 feet, or 11,520 cubic feet. The total tunnel air volume is 17,280 cubic feet. See Figure 2.
Once the cubic feet of air volume in the tunnel is known, the following formula is used to determine the cubic feet per minute (CFM) needed to exchange the entire volume of air every two hours, where V is the total air volume:
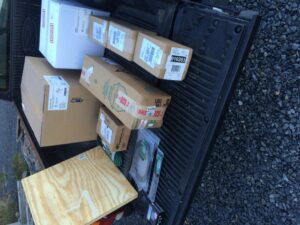
All the components and materials needed to install the heat recovery system easily fit into the box of a small pickup truck. Photo: Chris Lent, NCAT
CFMuk=(V/2)60
CFM=(17,280/2)60
CFM=144
As a result, we would need a ventilation unit rated at 144 CFM. A 106-CFM unit was chosen for this project in order to save money; however, this turned out to be a mistake. After seeing the results, participants determined that it would have been better to oversize, rather than undersize, the unit.
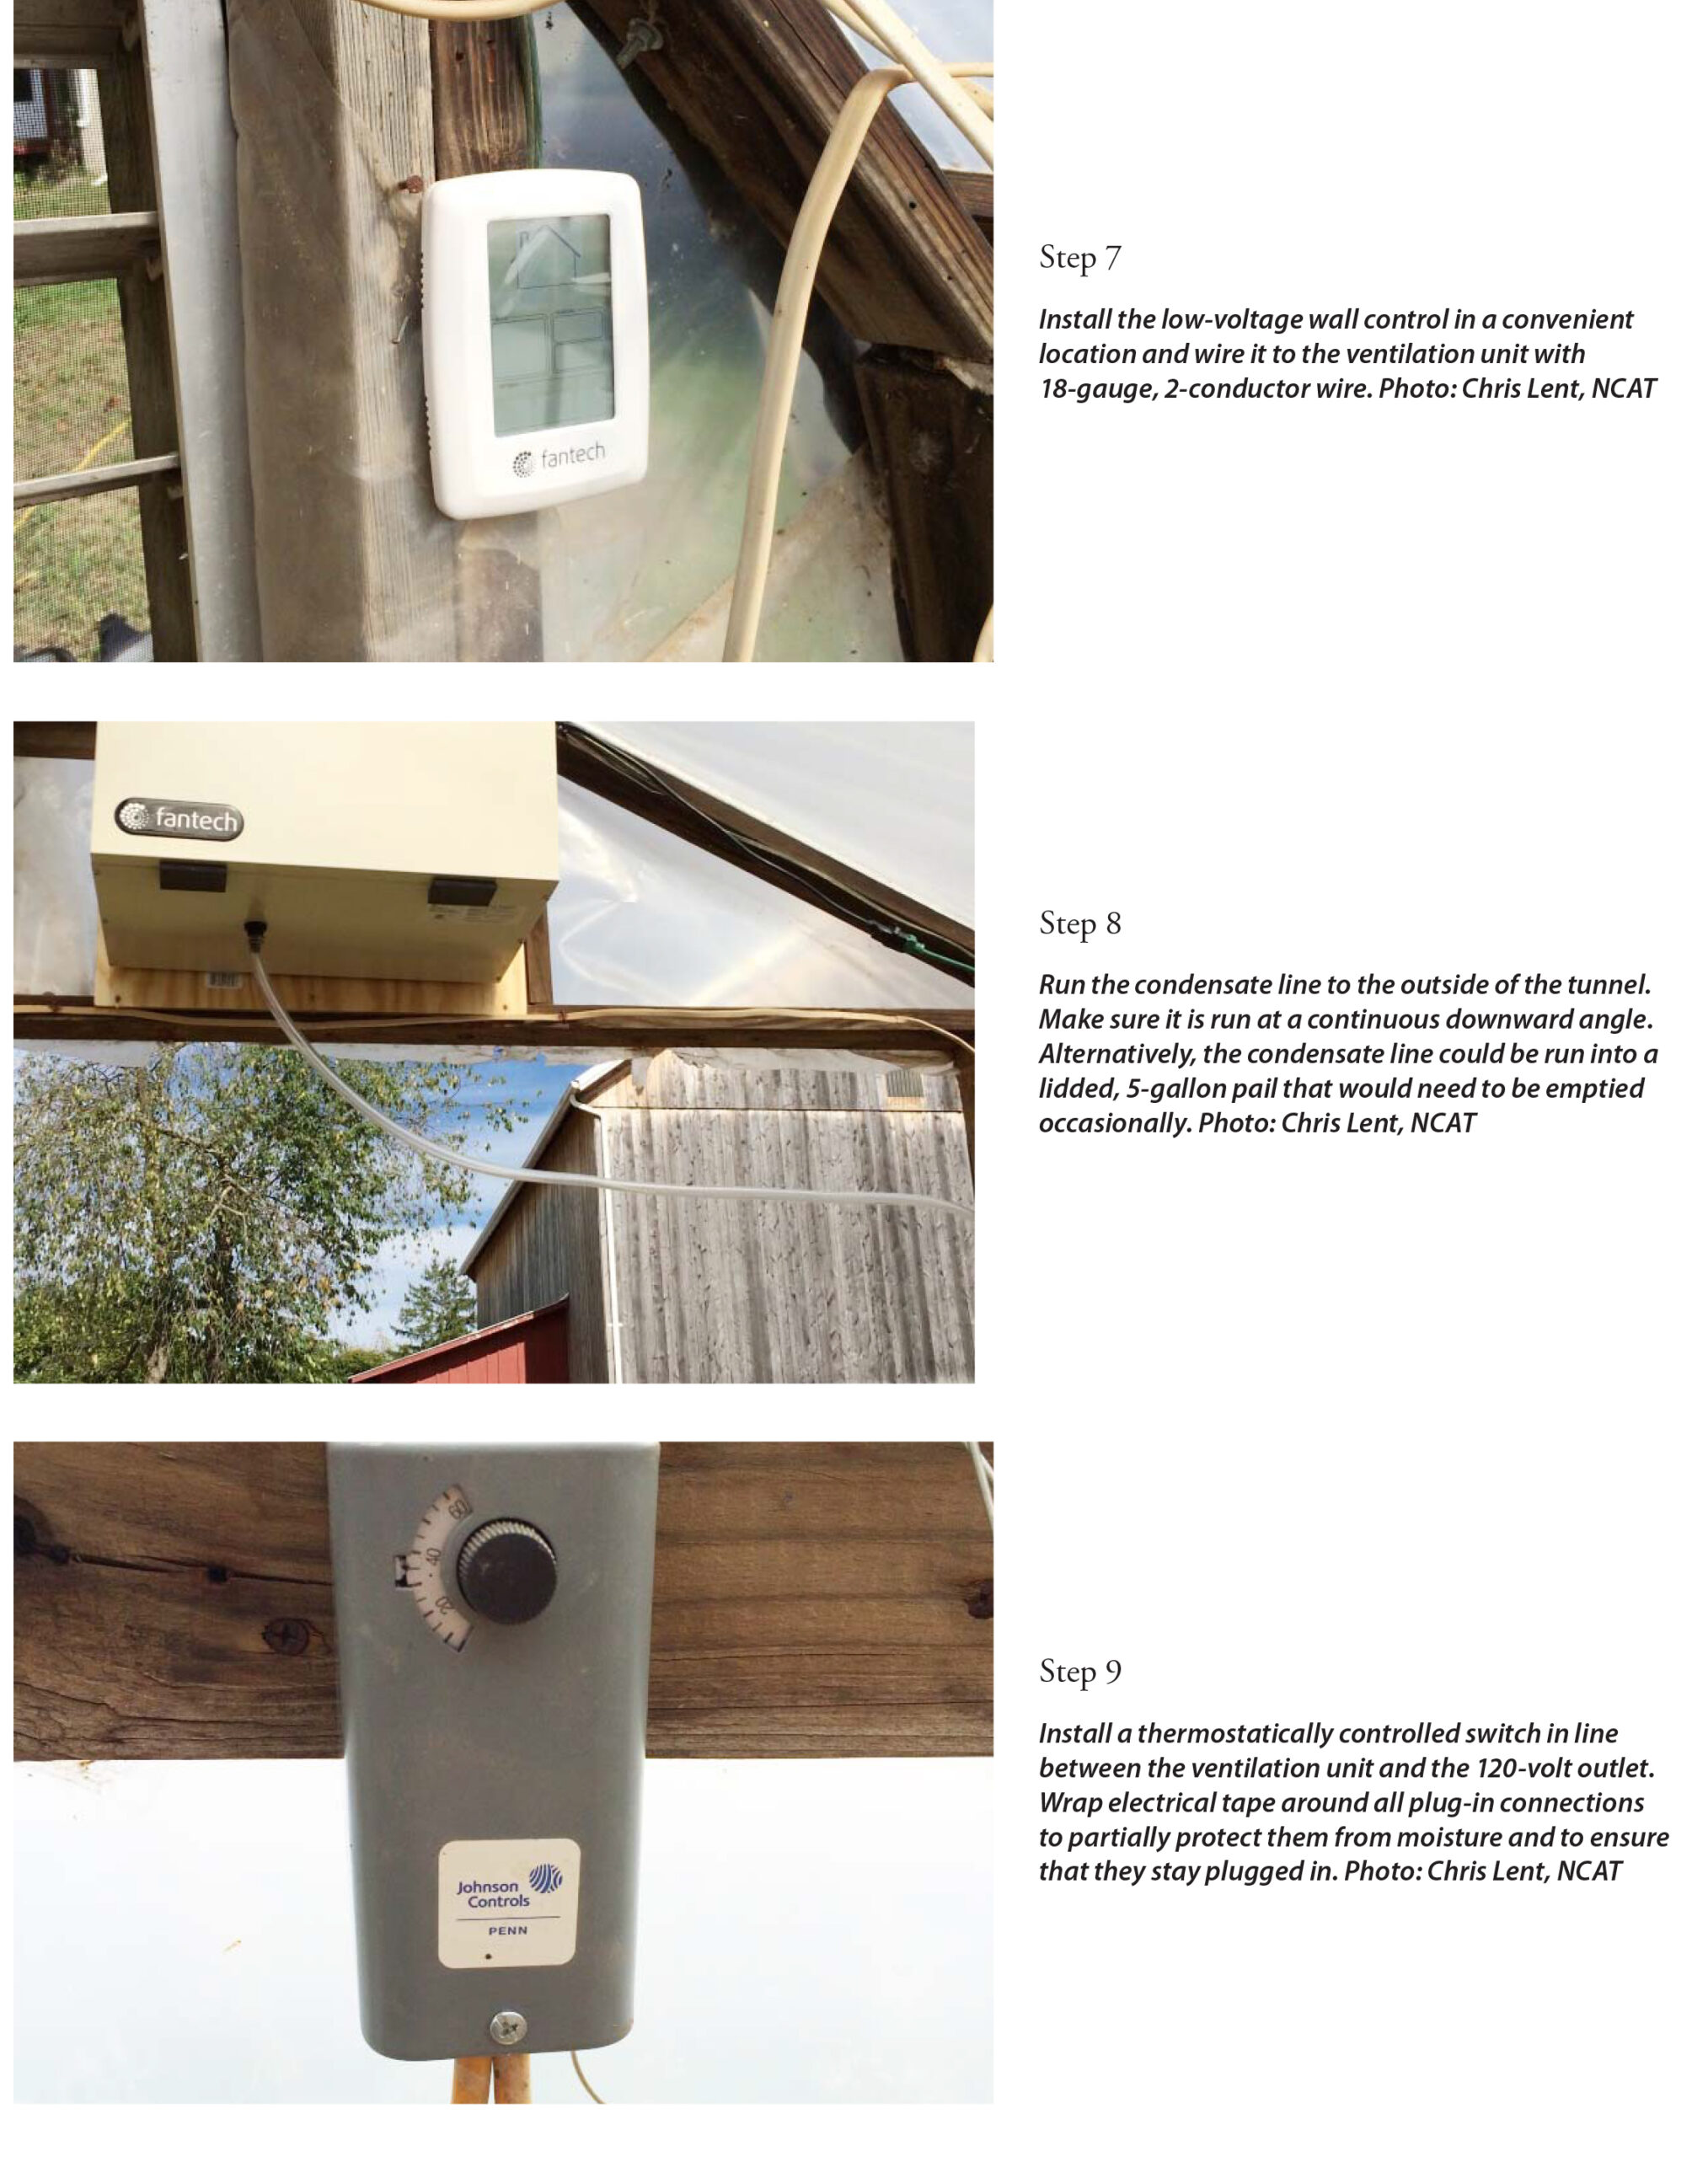
Installation
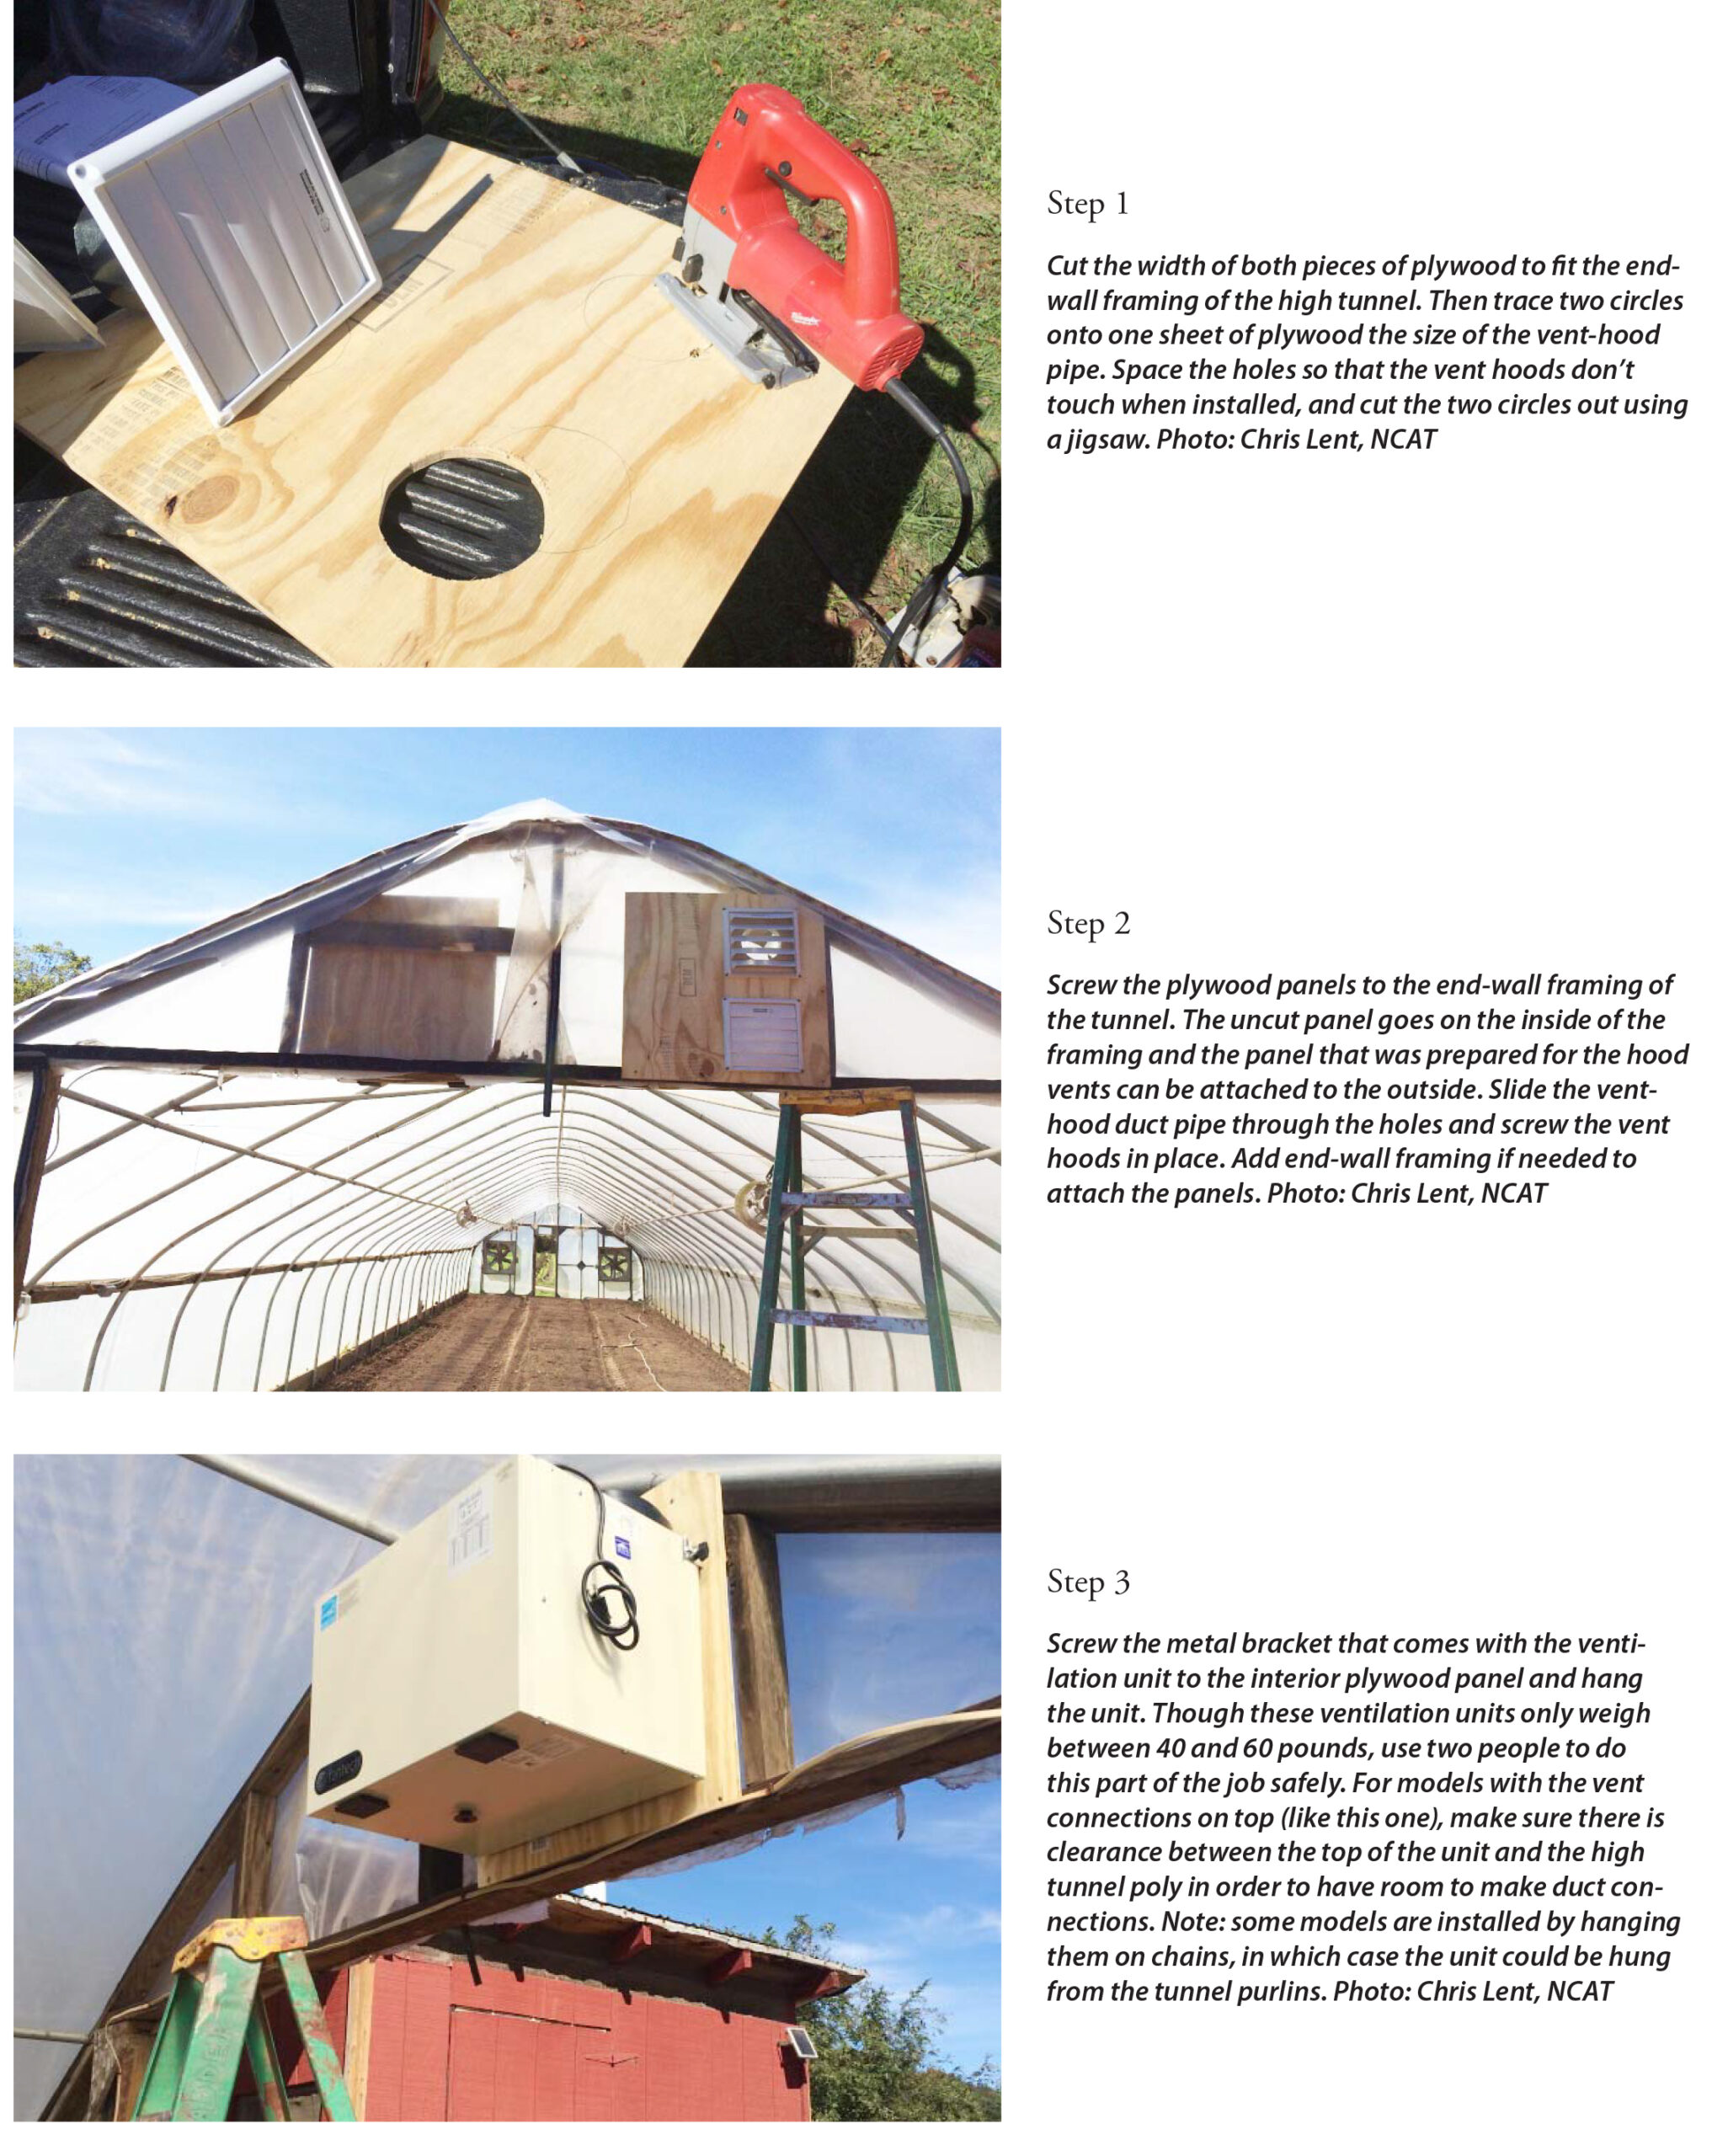
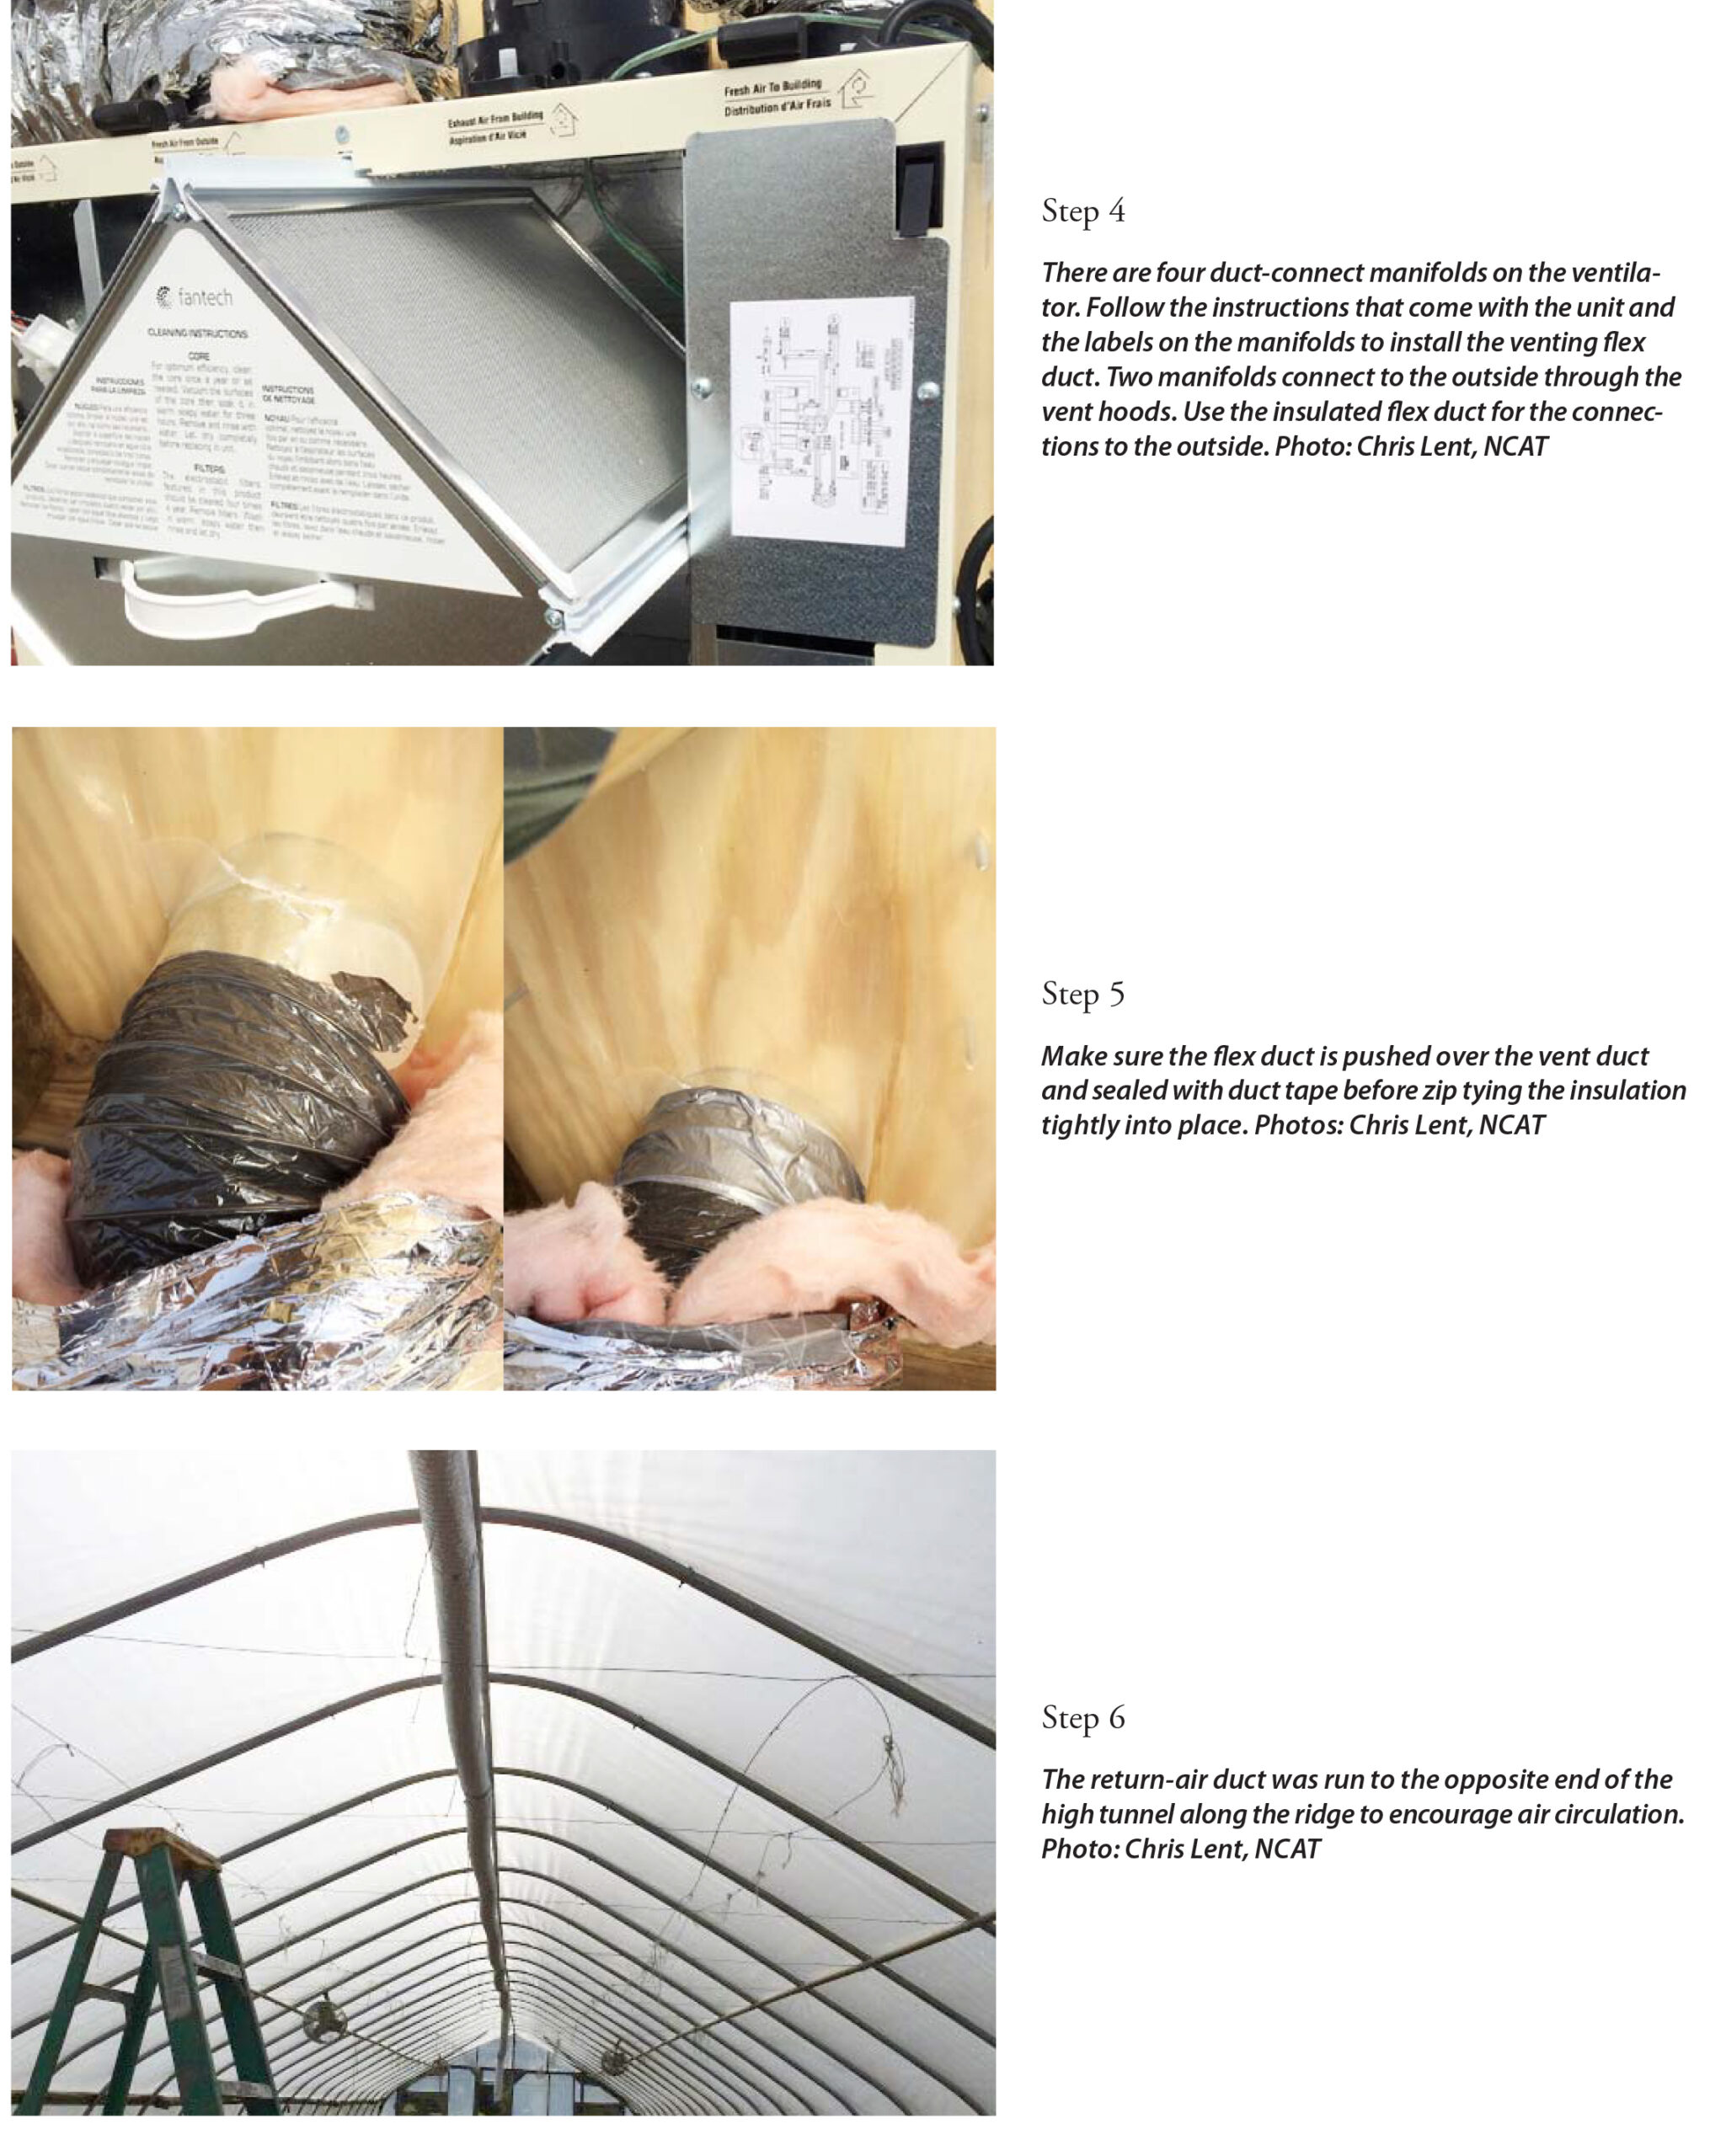
The installation of the ventilation equipment for this project took six hours. This includes time for setting up the data collection and monitoring equipment. One person can do most of the installation, but some help is needed to lift the ventilation unit into place safely. Following are pictorial instructions on how the system was installed and the tools that are needed for the installation.
Project Description and Analysis
The project set out to answer the following four questions:
- Can an air-to-air heat exchanger keep relative humidity (RH) below 85% in winter production in a high tunnel?
- Will a high tunnel being ventilated with a heat exchanger in cold weather have a higher average daily temperature compared to a traditionally vented tunnel?
- If the average daily temperature is increased by the use of a heat exchanger, is crop growth subsequently increased and to what degree?
- If crop growth is increased significantly, does the increased production justify the cost of a heat recovery ventilator?
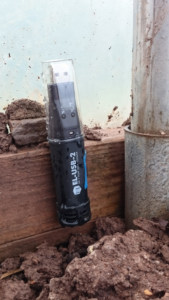
Easy Log – USB data loggers were placed in both tunnels and outside. Photo: Chris Lent, NCAT
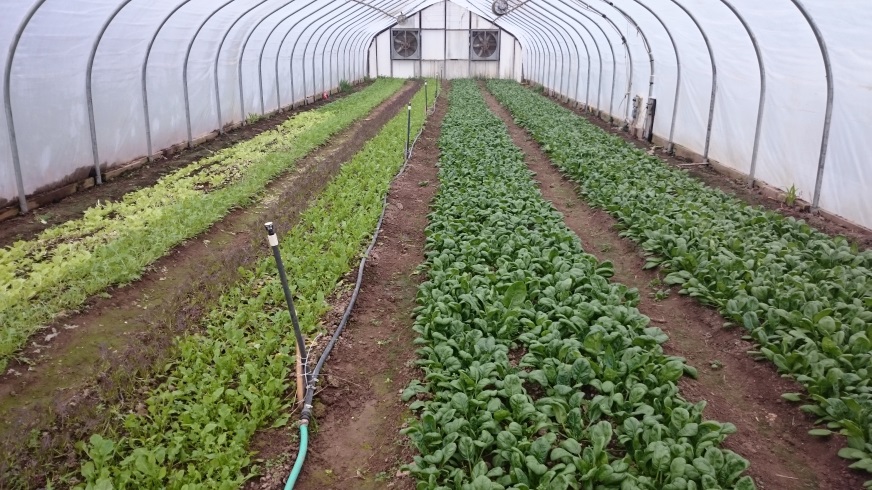
Two 20-foot by 96-foot high tunnels on New Morning Farm were selected for this project. The ventilation equipment was installed in the Lower High Tunnel (LHT), while the Upper High Tunnel (UHT) was used as a control. To try to make soil conditions in each tunnel equal, soil samples were taken in each tunnel in early September and sent to the Penn State Analytical Labs for testing. The soils were amended based on the sample to prepare for the winter crop of half Asian greens and half spinach planted in each tunnel.
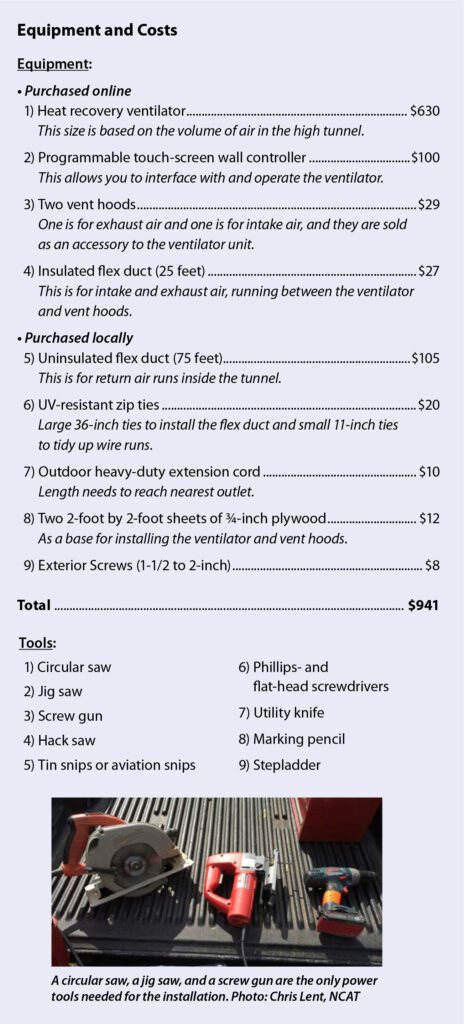
All ventilation and data-logging equipment was purchased in September. This included a 106-CFM Fantech Heat Recovery ventilator, supply air and exhaust hood, flexible duct work, and EL-USB 2 data loggers for temperature and humidity recording. Most of the equipment was purchased online, but some of the materials for the installation were purchased from local supply stores. The breakdown of what was shipped versus local purchases appears in the Equipment and Costs section, above.
On October 6, 2015, the ventilation equipment in LHT and the data loggers were installed in both high tunnels and outside of the tunnels.
The tunnels were planted and closed for the winter on October 29, and that is when the data loggers started to record information. The data recording stopped on March 21, 2016, when the tunnels were opened and prepared for summer crops. One thing that needs to be considered that may have affected the data is that the weather through the fall and early winter was relatively warm. This is important because the ventilation unit should offer the most benefit at maintaining higher temperatures on cold sunny days. That’s when it’s warm in the tunnel and normal ventilation would lessen the heat gain in the tunnel. So, in a colder year we might have seen a bigger temperature advantage with the HRV.
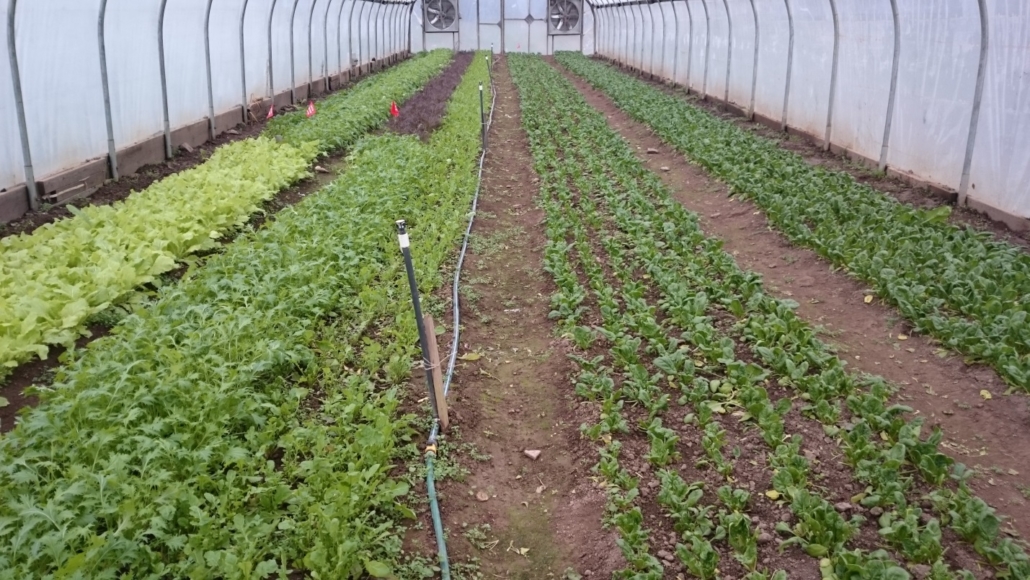
By mid-December, a first crop of spinach had been picked in the LHT (upper photo) and the UHT was ready for harvest (lower photo). Photos: Pearl Wetherall, New Morning Farm
Humidity Analysis
To answer the first question and see if the heat exchanger controlled moisture in the tunnel, relative humidity (RH) data from the two tunnels was compared (See Graph 1). The solid pink (middle of the upper set) line in Graph 1 shows that the heat recovery ventilator was not able to keep the relative humidity in the LHT below the 85% threshold.
In fact, the relative humidity readings in both tunnels were higher than anticipated. The average RH in the LHT over the period of the trial was 94.8%, compared to the upper high tunnel’s average RH of 99.5%. All else equal, this indicates that the ventilator helped lower the humidity on average by almost 5% in the LHT. Although it did not maintain RH below 85%, it did lower average RH over the winter.
You can also see from Graph 1 that the RH in the LHT corresponds with the outside RH readings more closely than the UHT RH readings do. A possible and likely explanation for this is that the HRV in the LHT was pulling in cooler dry air from the outside, thus lowering the RH inside the high tunnel. With regard to RH, this data shows that the HRV was performing as anticipated.
Note: Some RH readings in both tunnels were higher than 100%, which indicates calibration problems with the data collection equipment. However, readings from all three sources (LHT, UHT, and OUT) correlate with one another, indicating that the data loggers were at least reading consistently. In addition, the high tunnels were irrigated with overhead sprinklers prior to planting. This saturated the soil and provided a constant source of moisture for the duration of the project, contributing to the high humidity readings.
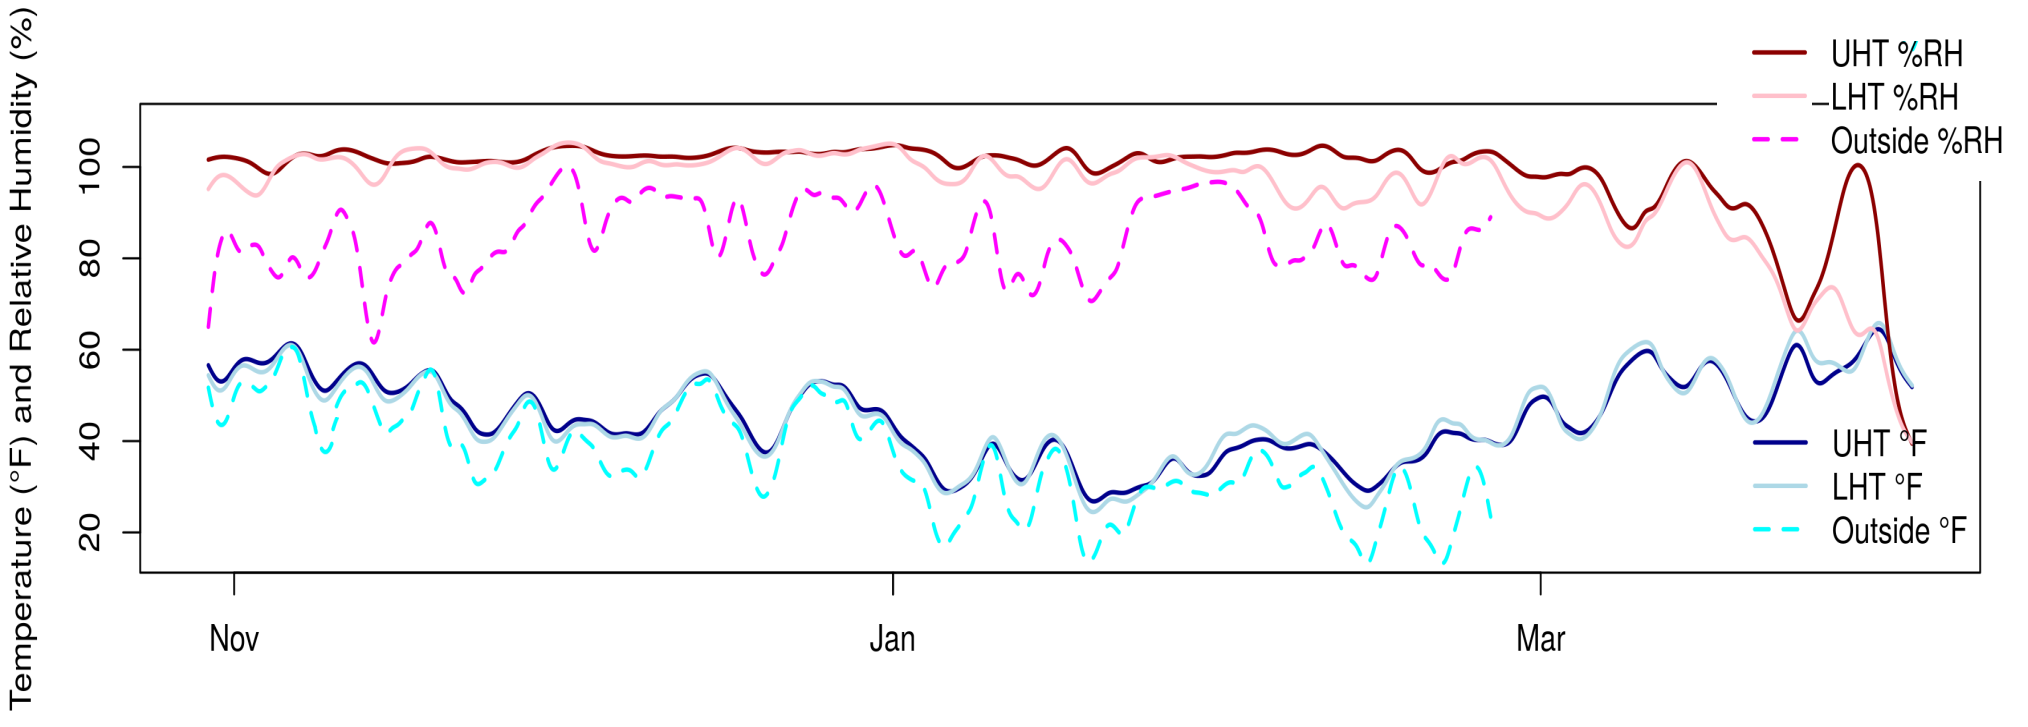
Graph 1. Temperature and Humidity Across All Three Treatments (Smoothed)
Temperature Analysis
To answer the question of whether or not the ventilator increases the average daily temperature, data from both tunnels was compared. In Graph 1, the lower set of lines indicates the temperature data points. The LHT temperatures crested above the UHT temperatures several times during the winter. However, on average, the daily temperature in the LHT was 42.2° F, and the temperature in the UHT was slightly higher, at 42.6°. So, the average daily temperature was slightly increased in the LHT. One explanation for this could be the operation of the ventilator in the lower tunnel, however the difference is very small.
There were many variables that may have affected this temperature outcome and they are discussed in the Observations section of this publication.
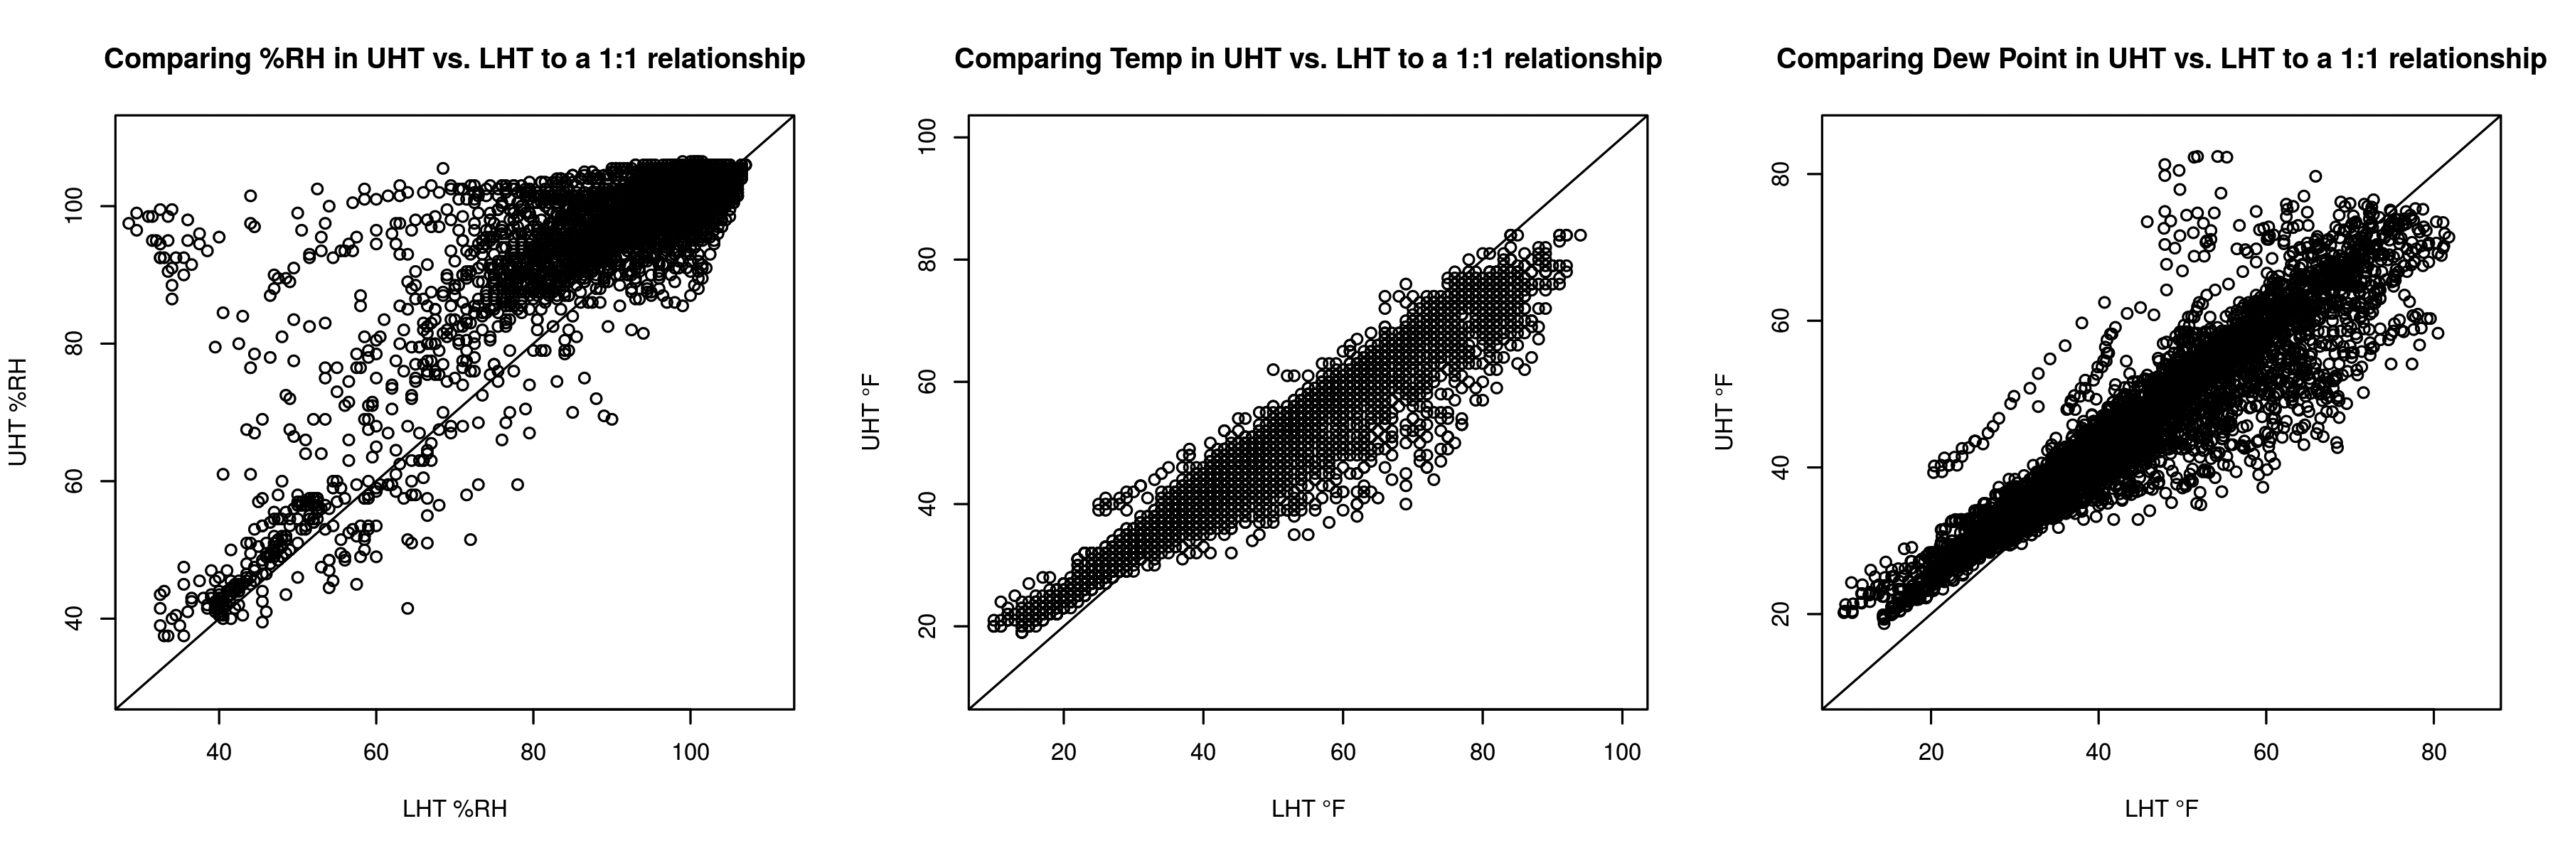
Graphs 2, 3, 4.
Graph 2 shows direct comparisons of the two high tunnels, the UHT, which is the control, and the LHT with the HRV installed. The 1:1 relationship line on the graphs offers a reference: if the data points are on the line, then the high tunnels are performing exactly the same. When comparing the RH (Graph 2) the LHT had reduced humidity, evidenced by the numerous data points above the 1:1 relationship line. This trend is consistent with the use of the HRV.
The comparison of temperature (Graph 3) reveals the trend that the UHT was cooler than the LHT, with numerous points below the 1:1 relationship line, with an exception at lower temperatures where the UHT is warmer than the LHT. This result was unexpected, but considering that the HRV system was controlled by an external thermostat that shut down if temperatures got below 35° F, in order to keep the condensation line from freezing, it is not surprising to see the HRV not performing at the lower temperatures.
Dew point (Graph 4) followed a trend similar to temperature, in which the UHT had a higher dew point at lower temperatures and a slightly lower dew point at higher temperatures.
Dew Point
Dew point data was not something we thought to look at when originally setting up the project; however, the data loggers used in the project automatically calculate dew point. It might be important to consider dew point, because it is the temperature at which condensation will form on leaves, creating more ideal conditions for foliar disease. In a winter high tunnel growing situation, the lower the dew point, the less time there is for condensation to form, because the temperature has to drop low enough to cool the plants to dew point.
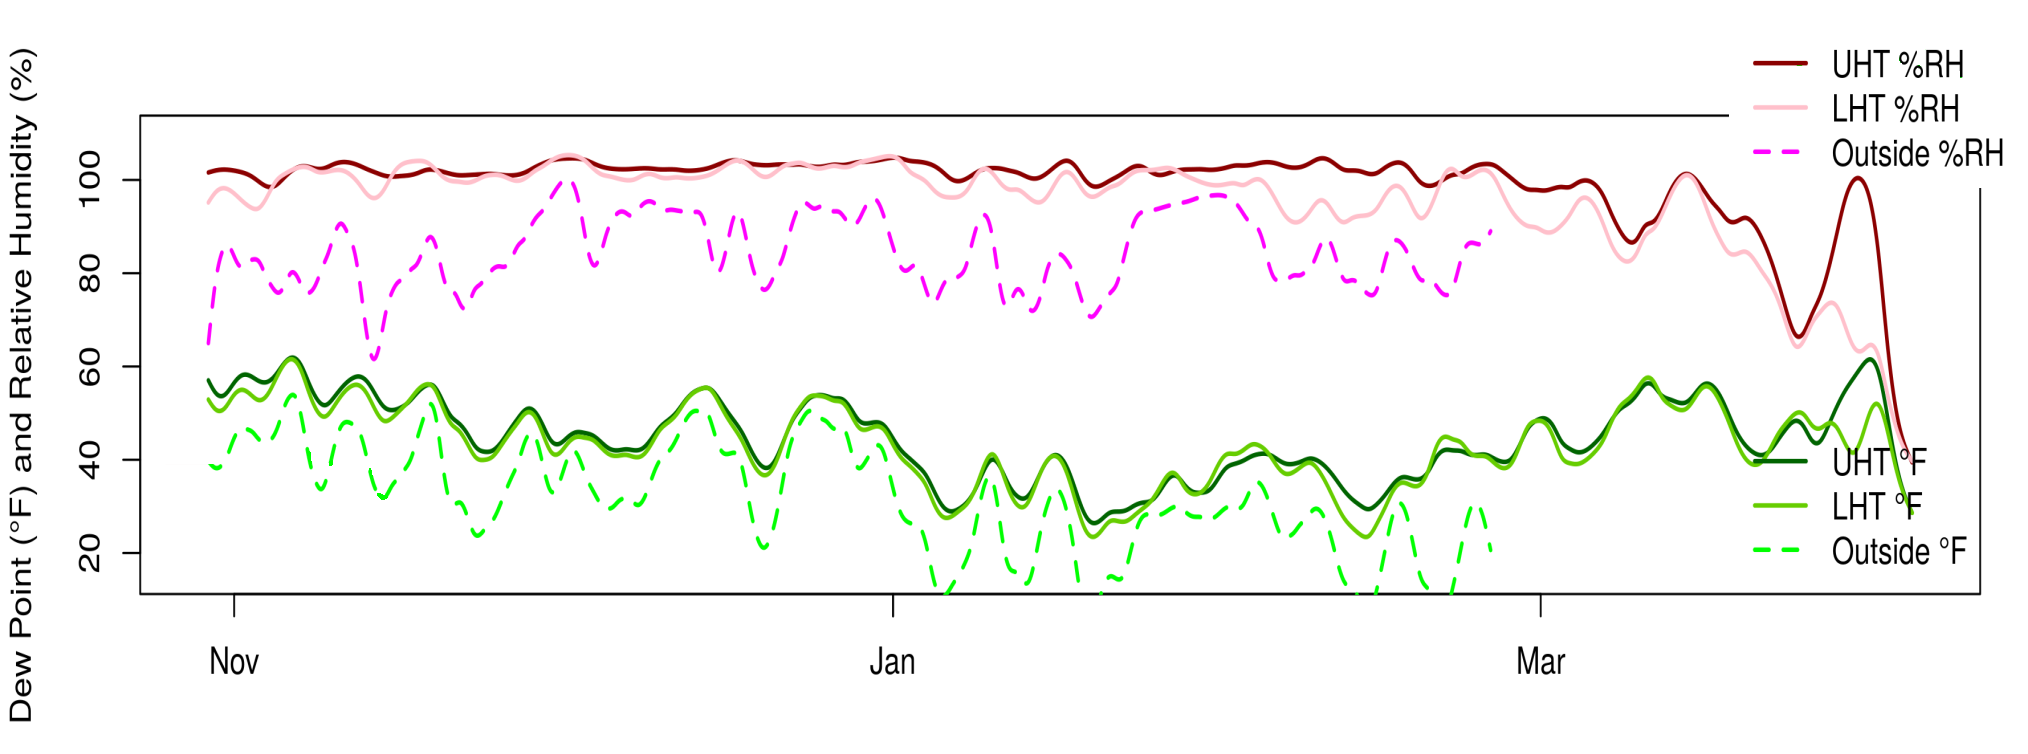
Graph 5. Dew Point and Humidity Across All Three Treatments (Smoothed)
The average dew point in the LHT was 40.3° compared to 42.2° in the UHT. This 2° difference is not much, but it reflects the lower relative humidity in the LHT and the effect it had on the dew point. This means that on average, the crops in the lower high tunnel would have to be 2° cooler than crops in the UHT in order for condensation to form on their leaves. Based on the small average temperature difference observed in the two tunnels and this dew point data, there would have been fewer opportunities for condensation to form on crops in the LHT. Admittedly, this difference may have been too small to have had any significant impact on disease control.
Crops
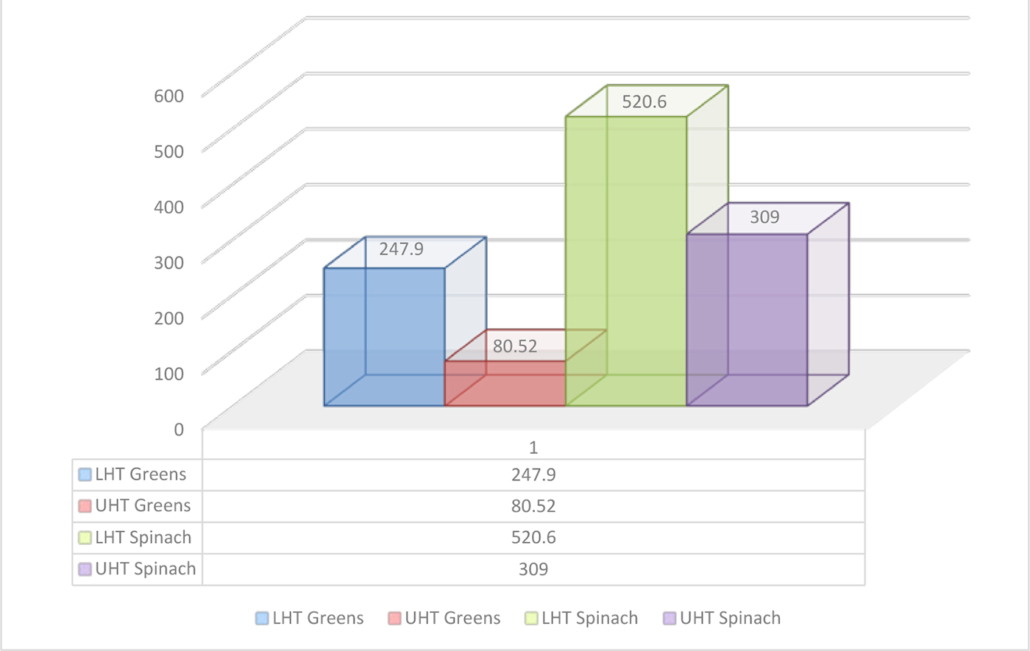
Graph 6. Crop-Production Comparison Between UHT and LHT
Because the average temperatures were almost equal in both tunnels, we would not expect to see increased production in the LHT. However, the harvest data shows that the LHT produced 211.6 pounds more spinach and 167.3 pounds more greens from the same amount of growing area. (See Graph 6.)
The spinach and greens were sold for a minimum of $12 a pound, so in economic terms, the LHT produced $4,548 more than the UHT. If the increase in production in the LHT could be attributed to the new ventilation equipment, the HRV installation would pay for itself more than four times in the first year.
Energy Use
The HRV that was installed for this project uses a maximum of 1.4 amps at 120 volts. So at the most, it uses 168 watts of energy when running. The unit did not run all the time during the project. It would shut down whenever the temperature dropped below 35°F. If we figured energy use on the worst-case scenario, by assuming it ran half the time, then the energy usage in kilowatts for the five-month trial would be 282 Kw. At $.12 a kW, it would cost $33.84 to run the unit.
Conclusions, Observations, and Recommendations
The HRV system was fairly simple to buy and install—they are simple systems that use common materials. The overall price for all the materials and equipment was about $1,000.
Looking at the data, the HRV did lower the RH and thus the dew point in the LHT. However, the average daily temperature was not effectively increased. Production was higher out of the lower tunnel, but it is inconclusive whether this can be attributed entirely to the ventilation equipment. More testing of this system is needed to determine its effectiveness. However, through this project there have been lessons learned about what could have been done differently to increase the effectiveness of the HRV.
Originally, the intent of the project was to measure the impact of venting a winter-production high tunnel with HRV in comparison to a traditionally vented tunnel. Traditional ventilation would mean that doors and shutters would be opened to allow for humidity control in the tunnel. However, the management practice of New Morning Farm is to close up the tunnels in the fall when winter crops are planted and then let a thermostatically controlled fan ventilate the tunnels if the temperature goes above 75° F. (This is how the two tunnels used in the project were managed over the subsequent 2015-2016 winter season.) This means that during the unusually warm winter of this project, the traditional ventilation systems in both tunnels kicked in more than usual, which mitigated any effect the HRV system could have had during these periods. For this reason, the mild winter could have had an influence on the data, and the results might have been much different in a colder year, or if the project had been moved farther north.
Along similar lines, the HRV system was controlled by an external thermostat that shut it down if the temperature got below 35° F. This was to keep the condensation line from freezing. Arguably, the HRV could be the most beneficial in conditions when temperatures are colder than 35° but the sun is out and heating the tunnel. In these conditions, the HRV could ventilate humidity without losing the heat gained by the sun. Having the unit shut down at 35° may have reduced its effectiveness in this project. There are HRV units with defrosters that would solve this problem, but they use more energy to operate, which was a consideration in this project.
Another issue that may have impacted the results of this project is that the 106-CFM unit chosen for this project was almost certainly undersized for the job. In looking at the size of the tunnel and aiming for a couple of air changes per hour, a 200-CFM unit or larger would have done a better job at exchanging the air in the tunnel and, for this reason, would have been a better choice.
References
Hartman, Ben. 2014. Eight tips for winter success. Growing for Market. October.
Worley, John. 2014. Greenhouses: Heating, Cooling and Ventilation. Bulletin 792. Cooperative Extension, University of Georgia, Athens, GA.
High Tunnel Winter Growing Using Heat Recovery Ventilation
By Chris Lent, NCAT Agricultural Specialist
Published September 2016
Updated August 2016
©NCAT
IP523
Slot 549
Version 092116
This publication is produced by the National Center for Appropriate Technology through the ATTRA Sustainable Agriculture program, under a cooperative agreement with USDA Rural Development. This publication was also made possible in part by funding from Northeast Sustainable Agriculture and Education. ATTRA.NCAT.ORG.