Sustainable Season Extension: Considerations for Design
By David Ryan, PE, NCAT Energy Engineer
Abstract
Growing food in cold climates can be difficult, but utilizing season-extension techniques, such as cold frames, hoop houses, and greenhouses, can help overcome these challenges. This publication assesses several greenhouse design elements and their effectiveness at extending the growing season in cold climates.
Contents
Introduction
Methodology
Basic Design Principles
Conclusion
References
Further Resources
Hoop House Structure in Belgrade, Montana. Photo: Dave Ryan, NCAT
Introduction
Growing food in cold climates can be difficult. Extreme temperature fluctuations, short growing seasons, and low humidity are among the challenges faced by growers in these climates. However, utilizing season extension techniques, such as cold frames, hoop houses, and greenhouses, can help overcome these challenges. Season extension refers to techniques or structures that allow crops to be grown beyond their normal outdoor growing season. Season extension enables growers to produce cash crops in cold climates, improving the economics of small farming operations and increasing consumer access to locally grown produce.
This publication helps producers evaluate greenhouse design elements for cold climates. The techniques described here could apply to cold frames, greenhouses, and hoop house structures—or to any building, for that matter. Thus, the terms ‘greenhouse’ and ‘hoop house’ are used interchangeably throughout this publication.
In small farm production—as in any other industry—economics rule. High-cost commercial greenhouses are used in every state to produce cash crops. Generally, these greenhouses are heated and cooled using electric fans and evaporative coolers, and natural gas- or oil-fired heaters. The energy use in these buildings can be 10 to 30% of the operating costs of the greenhouse (Wisconsin Focus on Energy, 2008). Hoop houses (also called “high tunnels”) are simple greenhouses that have little or no heating or cooling systems other than natural solar heating and natural ventilation. Hoop houses provide less control of environmental conditions than full greenhouses, but they also cost substantially less. Hoop houses are constructed of pipes bent into a hoop shape and typically have no foundation. They usually are covered with a single layer of plastic and are ventilated by rolling up the covering on the sides. A typical high tunnel is relatively easily taken down and put up. In most areas, this is an advantage because it does not have a foundation and is considered a “non-taxable” structure.
This publication uses a common hoop house design as a basis for design comparisons. The goal is to determine the extent to which certain design features can extend the growing season. As you will see, the length of the growing season in a cold climate can be significantly increased by using a hoop house and improving coverings, decreasing air leakage, and increasing insulation levels.
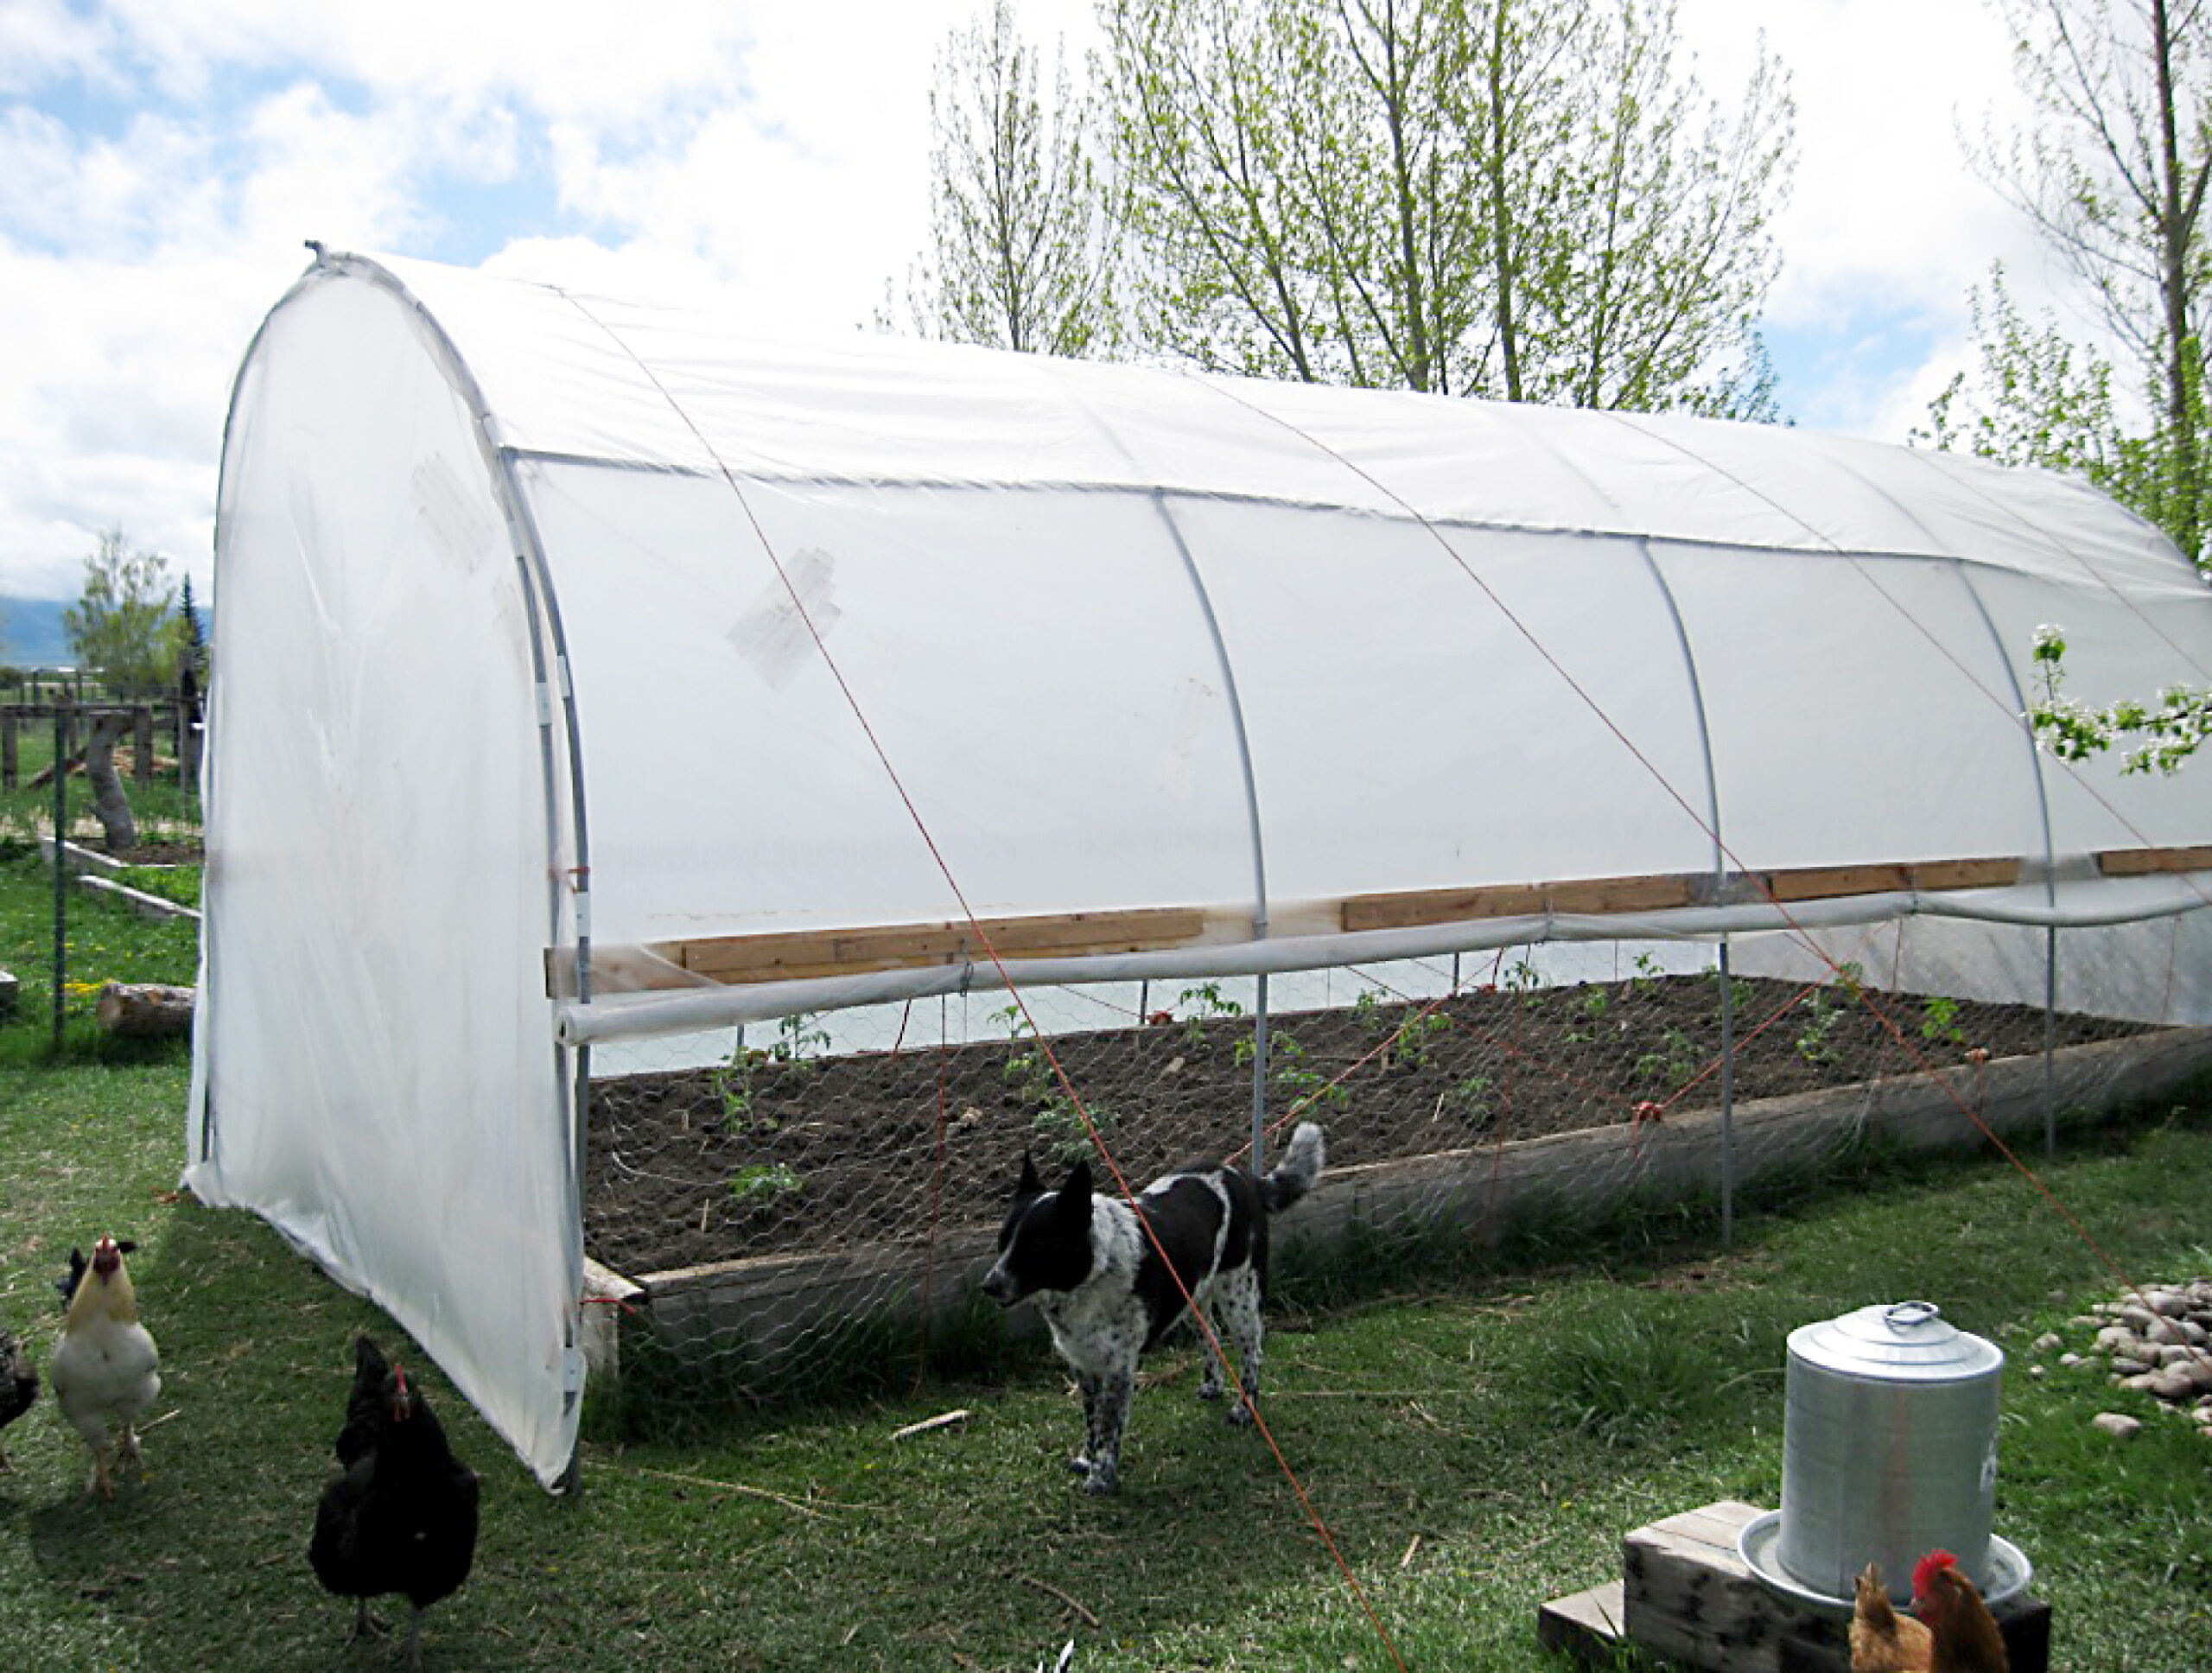
Hoop House. Source: NCAT
Are you a cold-climate farmer?
The United States Department of Agriculture has designated specific “zones” throughout the United States based on average first and last frost-free dates and minimum and maximum temperatures. The USDA Hardiness Zone Map divides North America into 11 separate zones; each zone is 10° Fahrenheit warmer (or colder) in an average winter than the adjacent zone (U.S. National Arboretum, 1990). If you see a hardiness zone in a catalog or plant description, it likely refers to the USDA map. Referring to the map helps establish a rough estimate of what types of crops, trees, and shrubs grow in your area. To find your zone, click here.
Methodology
This publication relies on Typical Meteorological Year (TMY) data to help evaluate greenhouse design in order to better predict the growing season, with an overall goal of extending the season farther into the fall and starting the season earlier in the spring. The methods described could also be used to evaluate the growing season for plants that need to be kept at higher temperatures, by changing the desired indoor temperature in the calculations. The examples are based on the freezing temperature point (32o F).
Specifically, the evaluations in this publication are based on TMY data for Butte, Montana (USDA Zone 3). This evaluation will consider the implication of Butte’s harsh climate in three cases:
- An open garden with no greenhouse at all
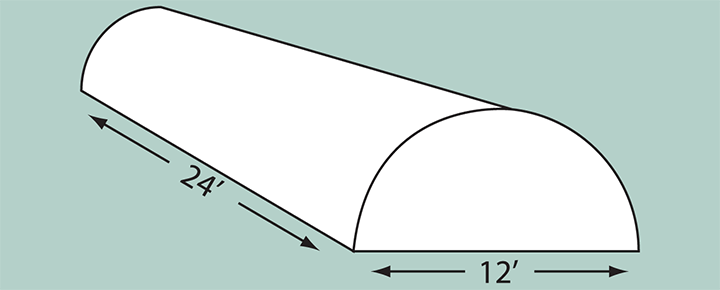
- A “base case” hoop house that is 4 meters by 8 meters (about 12 feet by 24 feet). This model hoop house is constructed using PVC pipe and is covered with a single layer of 6-mil polyethylene. This model has a high air-infiltration rate (often referred to as “leaky”).
- A hoop house with two layers of polyethylene and built much tighter (less leaky), including rigid foam insulation around the perimeter. This “efficient case” hoop house will demonstrate that the additional cost and effort in making the hoop house more energy-efficient will result in a longer cold-climate growing season.
Basic Design Principles
The two primary goals when designing a hoop house for cold climates are efficient collection of solar energy and prevention of heat loss. (Heat storage also is important but since it is so dependent upon the individual greenhouse, it is only discussed in broad terms.) These goals can be accomplished with the following basic design principles:
- Solar Orientation: Hoop house is oriented to receive maximum solar heat during the winter.
- Glazing: Glazing material is chosen and installed in a manner that minimizes heat loss.
- Heat Loss: Large amounts of insulation are installed where there is little or no direct sunlight.
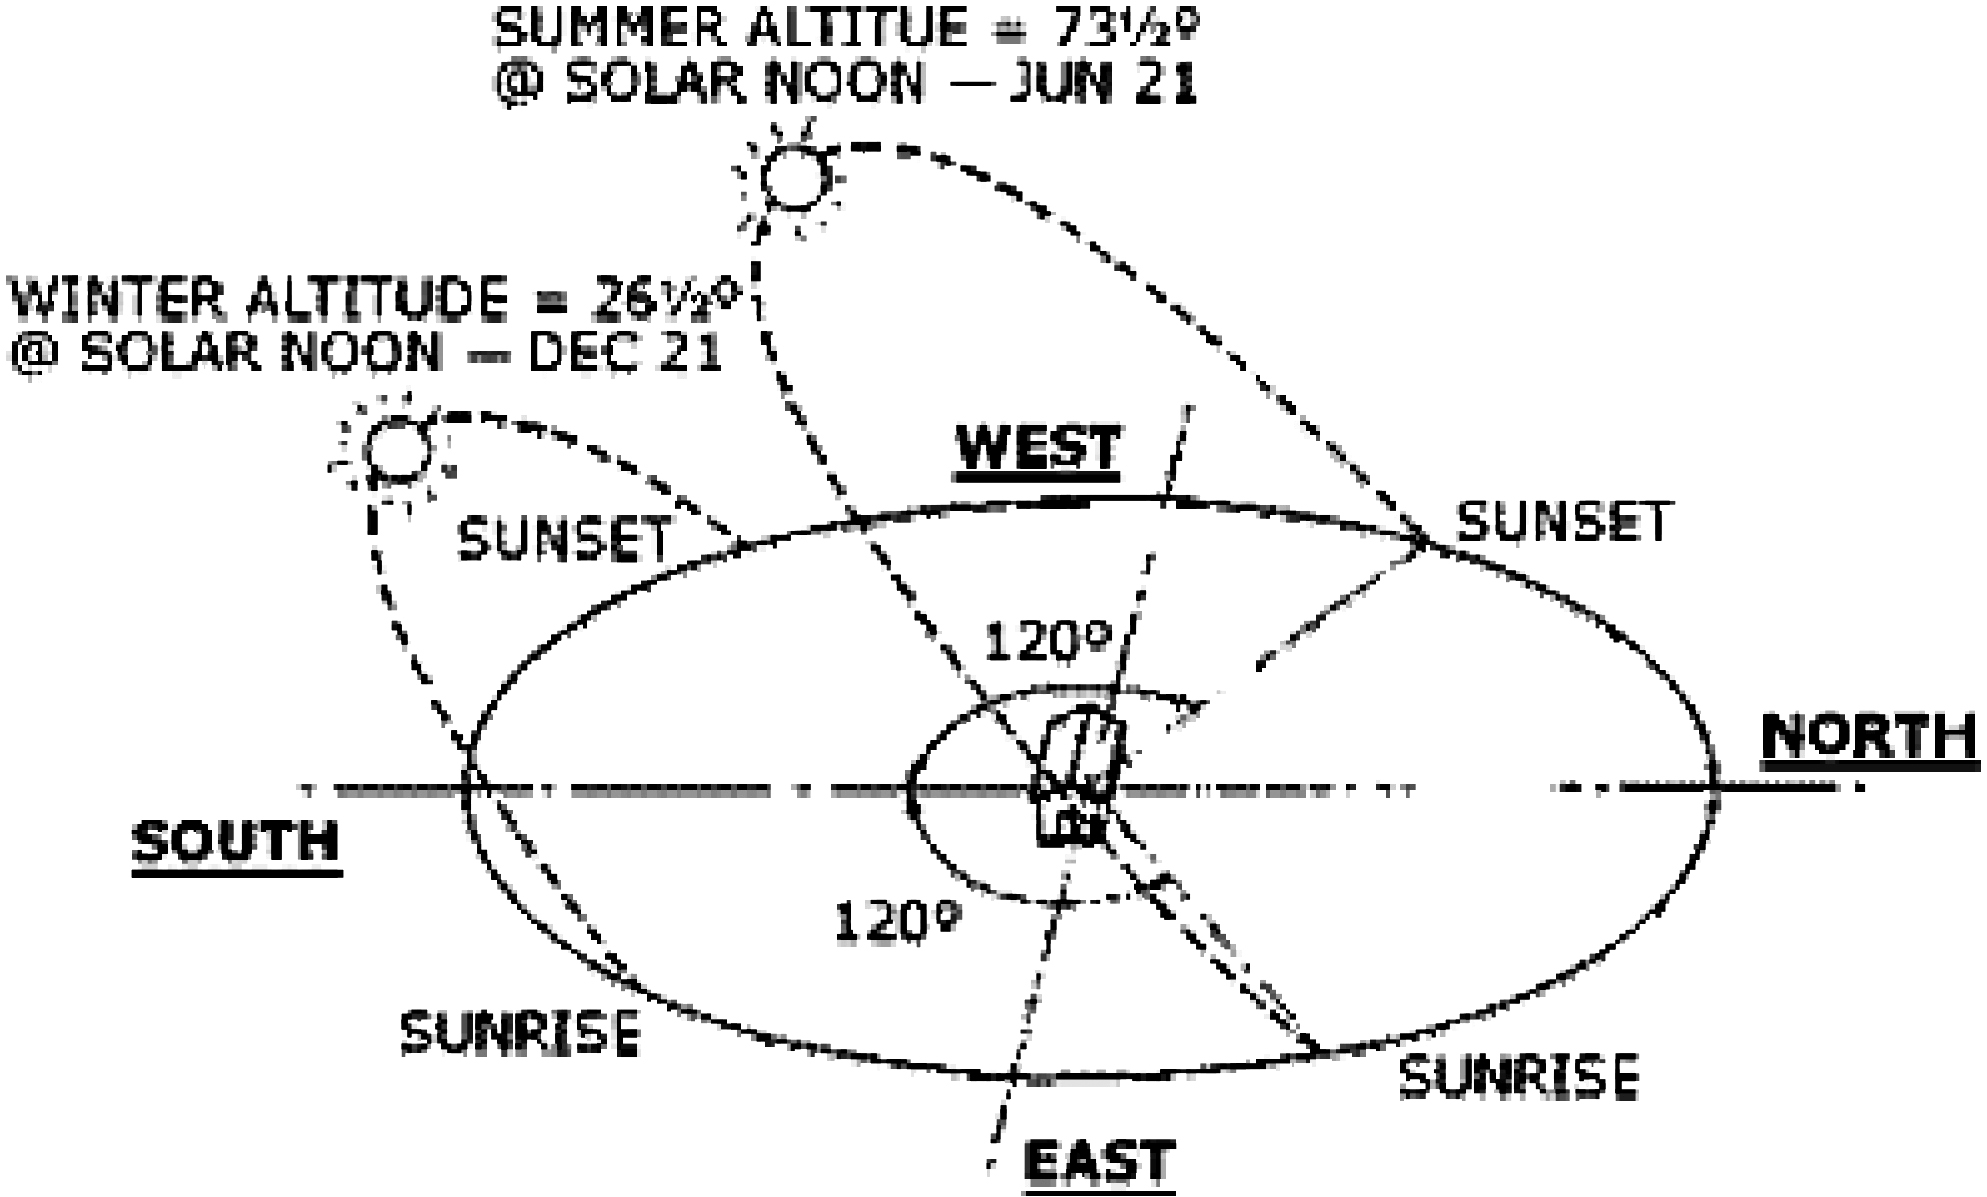
Figure 1. Solar Path at 40 degrees North Latitude. Source: Barbara Bellows, NCAT
Solar Orientation
Since the sun’s energy is strongest on the southern side of a building, glazing for solar greenhouses should ideally face true south. However, if trees, mountains, or buildings block the path of the sun when the greenhouse is in a true south orientation, an orientation within 15° to 20° of true south will provide about 90% of the solar capture of a true-south orientation. The latitude of your location and the location of potential obstructions may also require that you adjust the orientation of your greenhouse slightly from true south to obtain optimal solar energy gain (Mother Earth News, 1978). Some growers recommend orienting the greenhouse somewhat to the southeast to get the best solar gain in the spring, especially if the greenhouse is used primarily to grow transplants (Wang, 2006). To determine the proper solar orientation in your area, visit the sun chart program at the University of Oregon Solar Radiation Monitoring Laboratory webpage. You need to know your latitude, longitude, and time zone to use this program.
Slope of Glazing Material
In addition to north-south orientation, greenhouse glazing should be properly sloped to absorb the greatest amount of the sun’s heat. A good rule of thumb is to add 10° or 15° to the site latitude to get the proper angle. For example, if you are in northern California or central Illinois at latitude 40° north, then the glazing should be sloped at a 50° to 55° angle (40° + 10° or 15°) (Bellows, 2008).
Hoop houses are basically all glazing; the cover is placed over the hoops and pulled tight down to the ground or near to the ground. Different references conflict on which orientation is the best for hoop houses, with some indicating that a north-south orientation is best in the summer, and an east-west orientation is best in the winter. This publication assumes a north-south orientation.
Shading
The greenhouse should be sited to achieve the greatest possible exposure to the sun. Trees and other buildings shading the greenhouse will have a dramatic negative effect on the plants growing in the shaded area of the greenhouse. In cold climates, the goal is to maximize the solar resource with proper orientation. Cooler air temperatures can help provide cooling to the greenhouse.
Glazing
The resistance to solar energy entering the greenhouse is called the Solar Heat Gain Coefficient (SHGC). SHGC varies by material and is determined by the transmission of light through the glazing and the heat absorbed by the glazing and re-radiated into the greenhouse. The heavier the glazing materials and construction, the more SHGC differs from light transmission, but SHGC is generally larger than transmission—roughly 2%. Table 1 identifies light transmission for common glazing products.
Table 1. Glazing Characteristics
(Bellows, 2008)
| Glass—single layer Light transmission*: 85-90% R-value**: 0.9Advantages: • Lifespan indefinite if not broken • Tempered glass is stronger and requires fewer support barsDisadvantages: • Fragile, easily broken • May not withstand weight of snow • Requires numerous supports • Clear glass does not diffuse light |
Factory-sealed double glass Light transmission*: 70-75% R-value**: 1.5-2.0 for double layer; 2.5 for low-emissivity (low-e)Advantages: • Lifespan indefinite if not broken • Can be used in areas with freezing temperaturesDisadvantages: • Heavy • Clear glass does not diffuse light • Difficult to install, requires precise framing |
| Polyethylene—single layer Light transmission*: 80-90% for new material R-value**: 0.87 for single filmAdvantages: • IR films have treatment to reduce heat loss • No-drop films are treated to resist condensation • Treatment with ethyl vinyl acetate results in resistance to cracking in the cold and tearing • Easy to install, precise framing not required • Lowest-cost glazing materialDisadvantages: • Easily torn • Cannot see through • UV-resistant polyethylene lasts only 1 to 2 years • Light transmission decreases over time • Expand and sag in warm weather, then shrink in cold weather |
Polyethylene—double layer Light transmission*: 60-80% R-value** double films: 1.5 for 5-mil film; 1.7 for 6-mil filmAdvantages: • Heat loss significantly reduced when a blower is used to provide an air space between the two layers • IR films have treatment to reduce heat loss • No-drop films are treated to resist condensation • Treatment with ethyl vinyl acetate results in resistance to cracking in the cold and tearing • Easy to install; precise framing not required • Lowest-cost glazing materialDisadvantages: • Easily torn • Cannot see through • UV-resistant polyethylene lasts only 1 to 2 years • Light transmission decreases over time • Expand and sag in warm weather, then shrink in cold weather |
| Polyethylene—corrugated high-density Light transmission*: 70-75% R-value**: 2.5-3.0Advantages: • Mildew-, chemical-, and water-resistant • Does not yellowDisadvantages: n/a |
Laminated Acrylic/Polyester film—double layer Light transmission*: 87% R-value**: 1.8Advantages: • Combines weatherability of acrylic with high service temperature of polyester • Can last 10 years or moreDisadvantages: • Arcrylic glazings expand and contract considerably; framing must allow for this change in size • Not fire-resistant |
| Impact modified acrylic—double layer Light transmission*: 85%Advantages: • Not degraded or discolored by UV light • High impact strength; good for locations with hailDisadvantages: • Acrylic glazings expand and contract considerably; framing must allow for this change in size • Not fire-resistant |
Fiber reinforced plastic (FRP) Light transmission*: 85-90% for new material R-value**: 0.83 for single layerAdvantages: • The translucent nature of this material diffuses and distributes light evenly • Tedlar®-treated panels are resistant to weather, sunlight, and acids • Can last 5 to 20 yearsDisadvantages: • Light transmission decreases over time • Poor weather-resistance • Most flammable of rigid glazing materials • Insulation ability does not allow snow to melt |
| Polycarbonate—double-wall rigid plastic Light transmission*: 83% R-value**: 1.6 for 6mm plastic; 1.7 for 8mm plasticAdvantages: • Most fire-resistant of plastic glazing materials • UV-resistant • Very strong • Lightweight • Easy to cut and install • Provides good performance for 7 to 10 yearsDisadvantages: • Can be expensive • Not clear, translucent |
Polycarbonate film—triple- and quad-wall rigid plastic Light transmission*: 75% R-value** triple walls: 2.0-2.1 for 8mm film; 2.5 for 16mm film R-value** quad wall: 1.8 for 6mm film; 2.1 for 8mm filmAdvantages: • Most fire-resistant of plastic glazing materials • UV-resistant • Very strong • Lightweight • Easy to cut and install • Provides good performance for 7 to 10 yearsDisadvantages: • Can be expensive • Not clear, translucent |
| * framing decreases the amount of light that can pass through and be available as solar energy ** R-value is a common measure of insulation. The higher the R-value, the greater the material’s insulating ability. |
|
A note on units of measure:
Figure 2 shows average solar radiation available on an annual basis in kilowatt-hours (kWh) per day. One kWh is equal to 3413 British thermal Units (Btu). Most heating systems are rated in Btu per hour of heating capacity—a typical home heating furnace might be 100,000 Btu per hour of capacity. According to the NREL map, Butte, Montana, gets an average of about 4.5 kWh per square meter of surface tilted at the degrees of latitude (in Butte, that is about 45o). This calculates to an average of 4.5 kWh per day per square meter of surface * 3413 Btu per KWh = 15,359 Btu per day per square meter of input. If the surface of the greenhouse glazing at the latitude angle of tilt is 4 meters by 8 meters (about 12 feet by 24 feet), then the average annual solar input is 15,359*4*8 = 491,488 Btu per day.
The other calculations in this publication use the horizontal illuminance of a hoop house with a mostly clear covering.
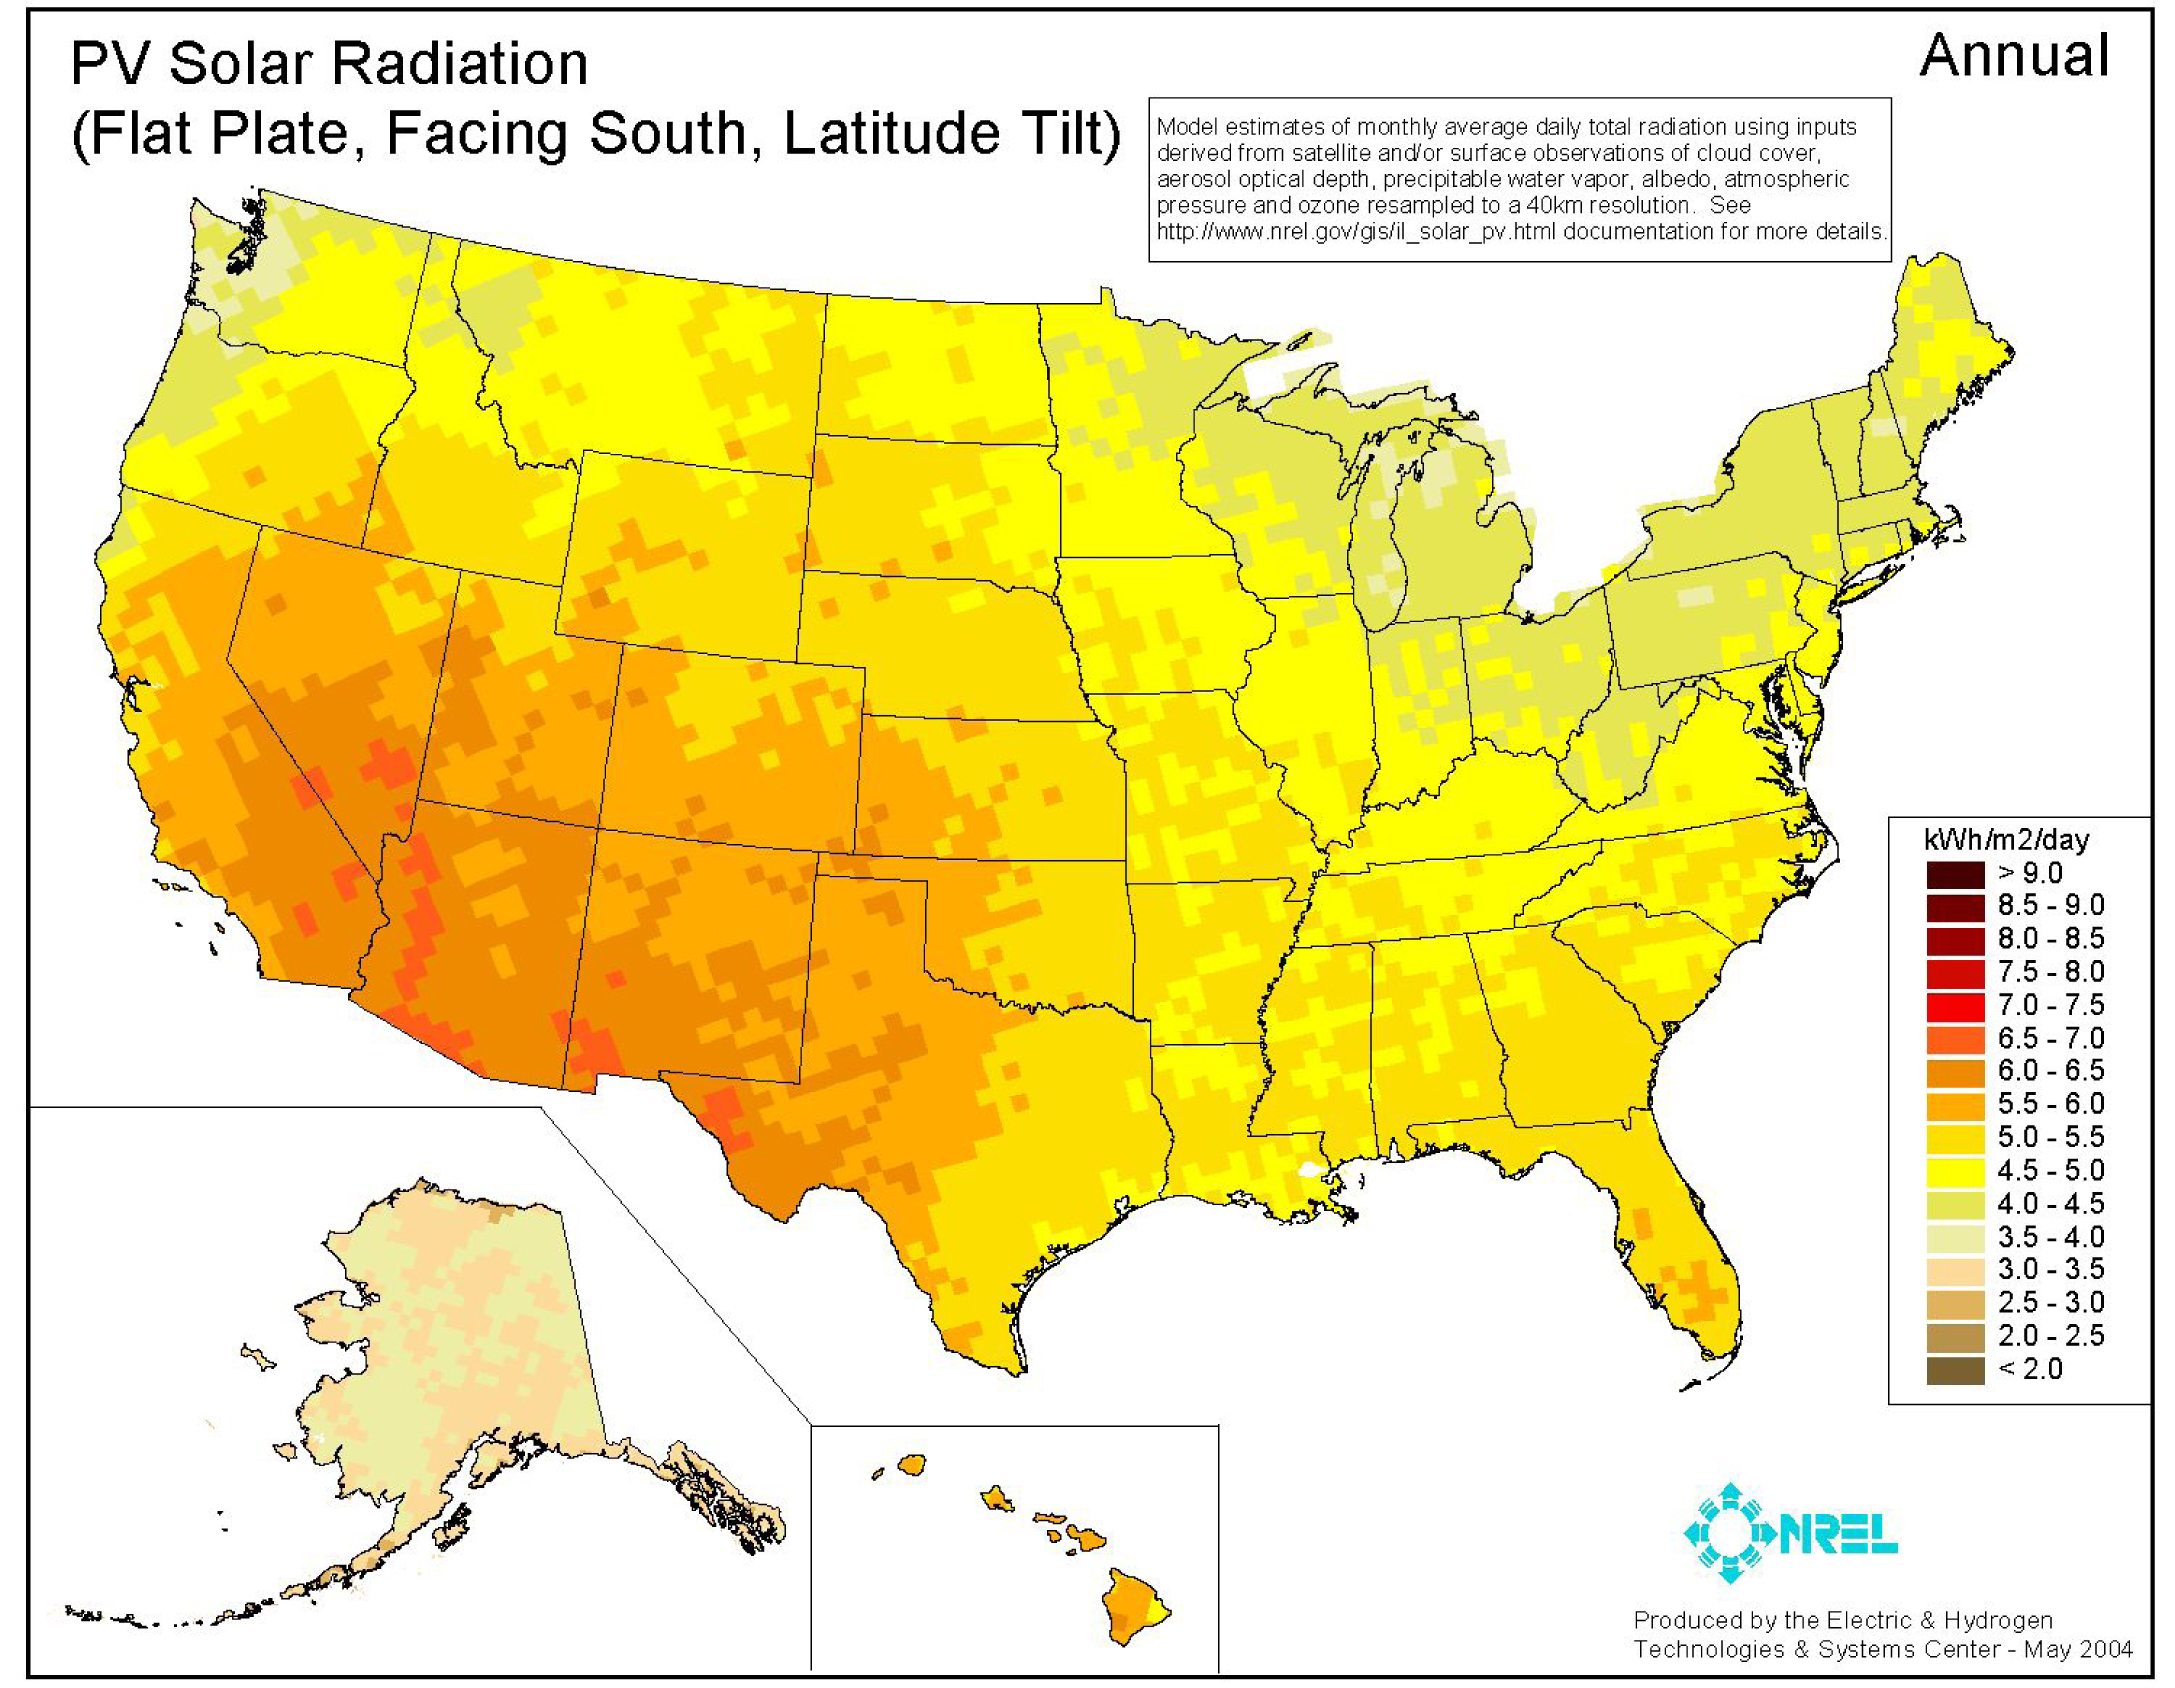
Figure 2. Annual PV Solar Radiation by Location. Source: NREL
The energy gain in a greenhouse due to solar heating is a function of how much solar radiation falls on the surface of the greenhouse covering, both directly and indirectly. Most of the energy is directly from the sun, but some surfaces such as buildings and trees also can result in solar gain. While Figure 2 shows annual average solar input, daily average input is more useful because it helps identify the critical “ends” of the growing season. The goal is to determine how much energy is typically available in the spring and fall in order to plan how much season extension is achievable. TMY data provides a standard for hourly data for solar radiation and other meteorological elements that allow performance comparisons of system types and configurations for one or more locations.
About TMY Data
A Typical Meteorological Year is not necessarily a good indicator of conditions over the next year—or even the next five years. Rather, it represents conditions judged to be typical over a long period of time, such as 30 years. Because they represent typical rather than extreme conditions, TMYs are not suited for designing systems and their components to meet the worst-case conditions occurring at a location. However, TMY data indicates what can be expected for typical weather conditions for a location, such as:
- Total amount of direct and diffuse solar radiation received on a horizontal surface during a period of time (to calculate solar heat gain)
- “Dry bulb” air temperature (to calculate heat loss from the greenhouse)
Other weather factors also come into play, such as wind speed and cloud cover, but this publication analyzes solar gain and heat loss from the greenhouse structure only.
The most current information can be found in TMY3 data. TMY3 is based on data for 1,020 locations in the United States, including Guam, Puerto Rico, and U.S. Virgin Islands, derived from a 1976-2005 period of record where available and a 1991-2005 period of record for all other locations (Wilcox, 2008).
The user’s manual for TMY3 data can be found here.
TMY data is presented hourly. Daily solar heat gain and heat loss can be calculated simply by adding the 24 hours of data for each day. Table 2 provides an example of TMY3 data for January 1 for Butte, Montana. The last column, GHI (Global Horizontal Illuminance), represents direct solar incidence plus diffuse radiation coming onto the horizontal surface from objects around the surface.
Table 2. Typical Meteorological Year Data for January 1 (Butte, Montana)
Source: NREL
| Date (MM/DD/YYYY) | Time (HH:MM) | ETR (W/m^2) | ETRN (W/m^2) | GHI (W/m^2) |
| 1/1/2002 | 1:00 | 0 | 0 | 0 |
| 1/1/2002 | 2:00 | 0 | 0 | 0 |
| 1/1/2002 | 3:00 | 0 | 0 | 0 |
| 1/1/2002 | 4:00 | 0 | 0 | 0 |
| 1/1/2002 | 5:00 | 0 | 0 | 0 |
| 1/1/2002 | 6:00 | 0 | 0 | 0 |
| 1/1/2002 | 7:00 | 0 | 0 | 0 |
| 1/1/2002 | 8:00 | 0 | 0 | 0 |
| 1/1/2002 | 9:00 | 56 | 1097 | 6 |
| 1/1/2002 | 10:00 | 234 | 1415 | 35 |
| 1/1/2002 | 11:00 | 379 | 1415 | 69 |
| 1/1/2002 | 12:00 | 473 | 1415 | 89 |
| 1/1/2002 | 13:00 | 507 | 1415 | 116 |
| 1/1/2002 | 14:00 | 480 | 1415 | 181 |
| 1/1/2002 | 15:00 | 394 | 1415 | 155 |
| 1/1/2002 | 16:00 | 255 | 1415 | 186 |
| 1/1/2002 | 17:00 | 76 | 1262 | 25 |
| 1/1/2002 | 18:00 | 0 | 0 | 0 |
| 1/1/2002 | 19:00 | 0 | 0 | 0 |
| 1/1/2002 | 20:00 | 0 | 0 | 0 |
| 1/1/2002 | 21:00 | 0 | 0 | 0 |
| 1/1/2002 | 22:00 | 0 | 0 | 0 |
| 1/1/2002 | 23:00 | 0 | 0 | 0 |
| 1/1/2002 | 24:00:00 | 0 | 0 | 0 |
The sum of the day’s GHI is 862 watt-hours per horizontal square meter. In January, 0.862 KWh per square meter, or 94,144 Btu per day, for a 12-foot by 24-foot greenhouse will probably not keep the greenhouse from freezing in the cold January weather. Table 6 later in this publication compares the heat loss for the same day in January with the solar input on that day.
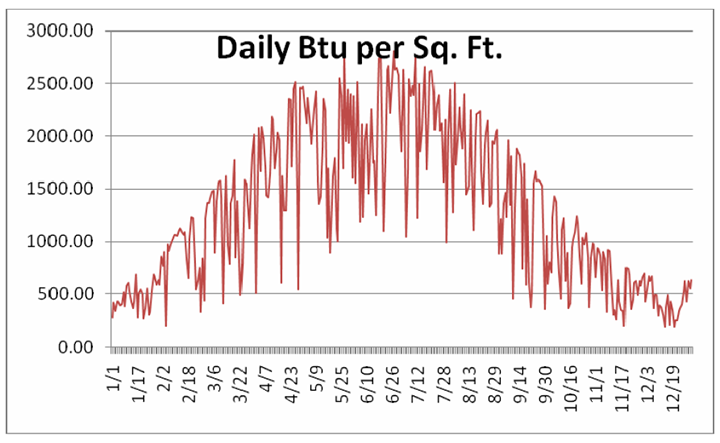
Figure 3. Typical Solar Gain for Butte, Montana. Chart represents solar gain on the floor of the hoop house. Source: NCAT
A Note on Adding Up the Data by Day
TMY data is stored in a computer format called ASCII Text. The data can be used in its raw form, but because there are 8,760 hours in a year and data for each hour, doing so would require considerable data entry using a calculator. It is more efficient to use an Excel spreadsheet or, even better, an Access database to analyze data. Figure 3 uses Excel to show the typical solar gain for Butte, Montana.
Heat Loss
There are three primary causes of heat loss in a greenhouse:
- Conduction heat loss from the covering or glazing. This is caused by the temperature difference between the inside of the greenhouse and the outside air.
- Infiltration, or leakage of cold air into the greenhouse. Cold air entering the greenhouse forces warm air out, requiring the cold incoming air to be heated.
- Perimeter heat loss, or heat loss around the outside margins of the greenhouse at ground level. Perimeter heat loss can be reduced by insulating and sealing the greenhouse to reduce air infiltration.
This publication analyzes two theoretical greenhouses of the same size and shape, but with different coverings, different air leakage rates, and different perimeter losses.
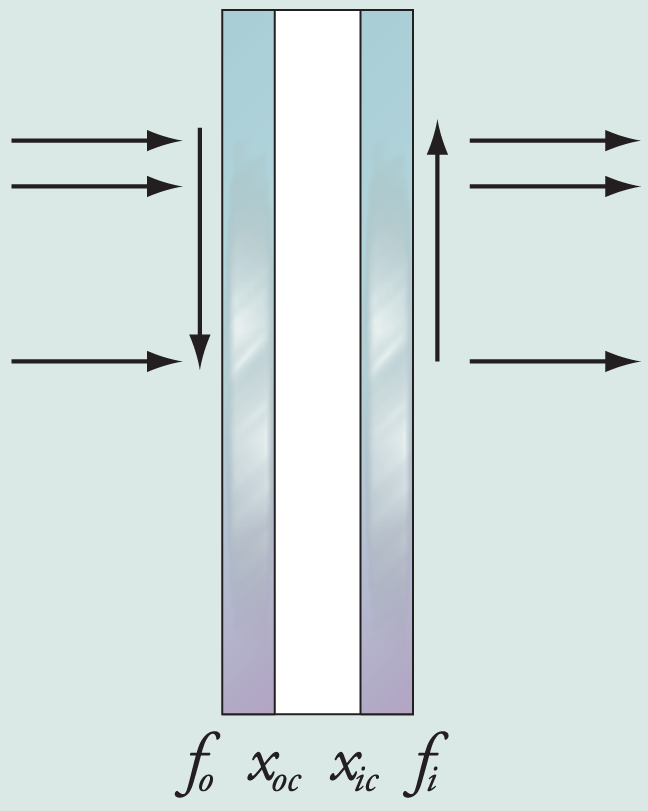
Figure 4. Transfer of Heat through a Double-Layer Greenhouse Covering. Source: NCAT
Conduction Heat Loss
Conduction heat loss (Qc) is a function of the heat-transfer characteristics of the greenhouse covering, the area of the greenhouse covering, and the temperature difference across the greenhouse covering. It is calculated with the formula Qc = UAΔT. The heat transfer coefficient (U) is the reciprocal of the additive resistances of the covering(s), the air space between the coverings, and the layers of air just on the inside and the outside of the coverings. Air movement on the inside and outside of the greenhouse covering also contributes to conduction heat loss through the cover. Figure 4 represents the transfer of heat through a double-layer greenhouse covering.
Most flexible greenhouse coverings are 6 mils thick. A mill is 1/1000 of an inch thick, so 6 mils is 0.006 inches thick. The air space in between the coverings can be designed into a greenhouse. The overall heat transfer coefficients (U-values) for various glazing materials are listed in Table 3. U-value assumes some air movement and takes into account the thickness of the glazing material, the thickness of the air space in between, and, in some cases, whether the air space is filled with some gas other than air (such as argon). Glazing manufacturers also may put a coating on the glazing material that decreases the emissivity of the glass (called “low-e” coatings). The units on the overall heat transfer coefficient are Btu per square foot per degree F per hour (BtuFt2 F Hr).
Table 3. Types of Cover Materials
Source: University of Georgia, College of Agricultural & Environmental Sciences
| Product | Light Transmission (%) | U- Value | |
| 3.5mm Solexx Roll | 75 | 0.476 | |
| 6mm Polycarbonate | Clear | 80 | 0.645 |
| Bronze | 42 | 0.645 | |
| Opal | 44 | 0.645 | |
| Gray | 42 | 0.645 | |
| 8mm Polycarbonate Clear | Clear | 80 | 0.635 |
| Bronze | 42 | 0.635 | |
| Opal | 44 | 0.635 | |
| Gray | 42 | 0.635 | |
| 16mm Polycarbonate | Clear | 78 | 0.545 |
| Bronze | 42 | 0.545 | |
| Opal | 44 | 0.545 | |
| Gray | 42 | 0.545 | |
| Single clear glass | 90 | 1.11 | |
| Single bronze glass | 68 | 1.11 | |
| Single azurlite glass | 77 | 1.11 | |
| Double clear glass | 82 | 0.55 | |
| Double bronze glass | 62 | 0.55 | |
| Double azurlite glass | 70 | 0.55 | |
| Double clear glass with low-e | 75 | 0.35 | |
| Double bronze with low-e | 57 | 0.35 | |
| Double SolarCool with low-e | 24 | 0.35 | |
| Double azurlite with low-e | 65 | 0.35 | |
| Double clear with low-e & argon gas | 76 | 0.33 | |
| Double bronze with low-e & argon gas | 57 | 0.33 | |
| Double SolarCool with low-e & argon gas | 24 | 0.33 | |
| Double azurlite with low-e & argon gas | 65 | 0.33 | |
| Single polyethylene Film | 90 | 1.2 |
Table 4. Heat Loss and Insulating Ability of Greenhouse Coverings
Source: Adaptive Plastics, Inc.
| Greenhouse Covering | R–value | U-value |
| 5mm Solexx™ Panels* | 2.3 | 0.43 |
| 3.5mm Solexx™ Panels* | 2.1 | 0.48 |
| 8mm Triple-Wall Polycarbonate | 2 | 0.5 |
| Double-Pane Storm Windows | 2 | 0.5 |
| 10mm Double-Wall Polycarbonate | 1.89 | 0.53 |
| 8mm Double-Wall Polycarbonate | 1.6 | 0.63 |
| 6mm Double-Wall Polycarbonate | 1.54 | 0.65 |
| 4mm Double-Wall Polycarbonate | 1.43 | 0.7 |
| Single-Pane Glass, 3mm | 0.95 | 1.05 |
| Poly Film | 0.83 | 1.2 |
| R-value: the measurement of insulating ability of the material. The higher the R-value, the greater the insulation value.
U-value: the measurement of heat loss through the material. The lower the U-value, the less the amount of heat that is escaping. *Independent testing,Solexx™ with caulked flutes. |
||
Covering (Glazing) Losses
The area for heat transfer includes all of the surfaces of the greenhouse exposed to the outside air. Our example analysis assumes ground temperature to be no less than 32o F (since the goal is freeze protection). The analysis is based on a hoop house that is constructed with 2-inch-diameter PVC pipe, and measures 12 feet wide by 24 feet long (about 4 meters by 8 meters). The PVC pipe is 20 feet long, so calculating the area of the covering is straightforward: 20 feet by 24 feet = 480 square feet. The area of the ends of the greenhouse if the ends are semicircles is πr2, where r = 6.37 feet. The area of the ends together is 127.48 square feet. The total area exposed to the weather is 607.5 square feet.
Our analysis compares two types of covering material: single-layer polyethylene, with a heat transfer coefficient of 1.2; and Solexx™ roll covering, which has a U-value of 0.48. The heat transfer (Qc) is now 607.5 square feet * U in Btu per square foot per degree F per hour * Temperature difference, or 706 ΔT for the single-roll covering, and 291.6 ΔT for the twin-wall Solexx™. Temperature difference is required to complete the calculation, which can be obtained from TMY3 data for typical outdoor air temperatures for our location. Again, for freeze protection, greenhouse temperatures no lower than 32o F must be maintained.
Infiltration Heat Loss
Cold air (less than 32o F) leaking into the greenhouse must be heated up or it will cause freezing damage to the plants in the greenhouse. The heat loss (Qi) is basically the mass of air (Volume * density of air) moving into the greenhouse from the outside multiplied by the heat capacity (Cp) of the air and then multiplied by the temperature difference (ΔT) between the outside air and the inside air (Qi = VrCpΔT). Again, we are only interested in the hours of the year where the outside air is below freezing. The volume of air moving into the greenhouse due to leakage is measured in the industry in typical air changes per hour (ACH). An air change means the entire volume of air in the greenhouse has been replaced by outside air due to leakage through the covering and around the base of the greenhouse. A leaky greenhouse might have two ACH, while a very tightly built greenhouse might have half of an ACH. Our analysis includes two cases: one in which the greenhouse has one ACH and one in which the greenhouse has two ACH.
For example, if a hoop house is 24 feet long and semicircular in shape with a radius (r) of 6.37 feet, the volume of air in the greenhouse is (πr2/2) * l = 1530 cubic feet of air. The density of air is about .071 pounds per cubic foot at the temperatures we are concerned with, and the heat capacity of air is about .17 Btu per pound degree F. Thus, the heat loss from one air change per hour is 486.9 cubic feet*.071 pounds/cubic feet *.17 Btu/pounds F * ΔT = 18.46 ΔT. TMY3 data identifies the hours where the air temperature is less than 32o F to find the length of the season.
Perimeter and Ground Heat Loss
Perimeter Heat Loss
Heat loss around the perimeter of the greenhouse can be calculated using Qp = F * P * ΔT
where:
F = perimeter heat loss factor (Btu/hour per linear foot per °F): Uninsulated 0.8, Insulated 0.4
P = greenhouse perimeter (in feet)
For our example, the perimeter is the distance around the outside of the greenhouse on the ground or (2*12 feet) (the ends) + (2*24 feet) (the sides) = 72 feet. The perimeter heat loss factor for uninsulated greenhouses is 0.8, so the heat loss is Qp = 0.8 * 72 * ΔT or 57.6ΔT. Insulating around the perimeter of the greenhouse with two inches of rigid foam will reduce the perimeter heat loss by half.
Total Estimated Heat Loss as a Function of Temperature Difference
Heat loss from all sources is added together, representing a function of indoor air temperature minus outdoor air temperature. Table 5 shows total heat loss estimates for two coverings, two levels of perimeter insulation, and two levels of air infiltration, based on an indoor air temperature of 32o F.
Comparing these figures shows that the worst heat loss from conduction occurs through the hoop house covering. Even with double glazing, the heat loss is 16 times the infiltration heat loss, and five times the perimeter heat loss.
Table 5. Total Heat Loss
Source: NCAT
| Base Case (Inefficient) | Change Case (Efficient) |
| Single-Wall Polyethylene | Twin-Wall Solexx™ |
| Qc = 729DT, SHGC = .90 | Qc = 291.6 DT, SHGC = .75 |
| No Perimeter Insulation | Perimeter Insulation |
| Qp = 57.6 DT | Qp = 28.8 DT |
| Two air changes per hour | One air change per hour |
| Qi = 36.9 DT | Qi = 18.5 DT |
Heat Balance
If we subtract the outdoor air temperature every hour in the TMY data from 32o F, we can see the total heat loss for that outdoor air temperature from the above relationships. We are not concerned with temperatures above 32o F because the greenhouse will not freeze. The key assumption is that if the outdoor air temperature is not too far below 32o F and there is a positive heat balance in those hours (that is, gain is larger than loss), then the greenhouse will not freeze. By taking the daily solar gain and subtracting heat loss, we can estimate how many days we can keep from freezing based on heat balance. We then can evaluate different measures to improve insulation, improve solar transmittance, and decrease infiltration.
Weather in Butte, Montana
According to TMY data for Butte, Montana, there are 3,229 hours when the outdoor air temperature is lower than 32o F. As Figure 5 illustrates, it typically freezes in almost every month in Butte.
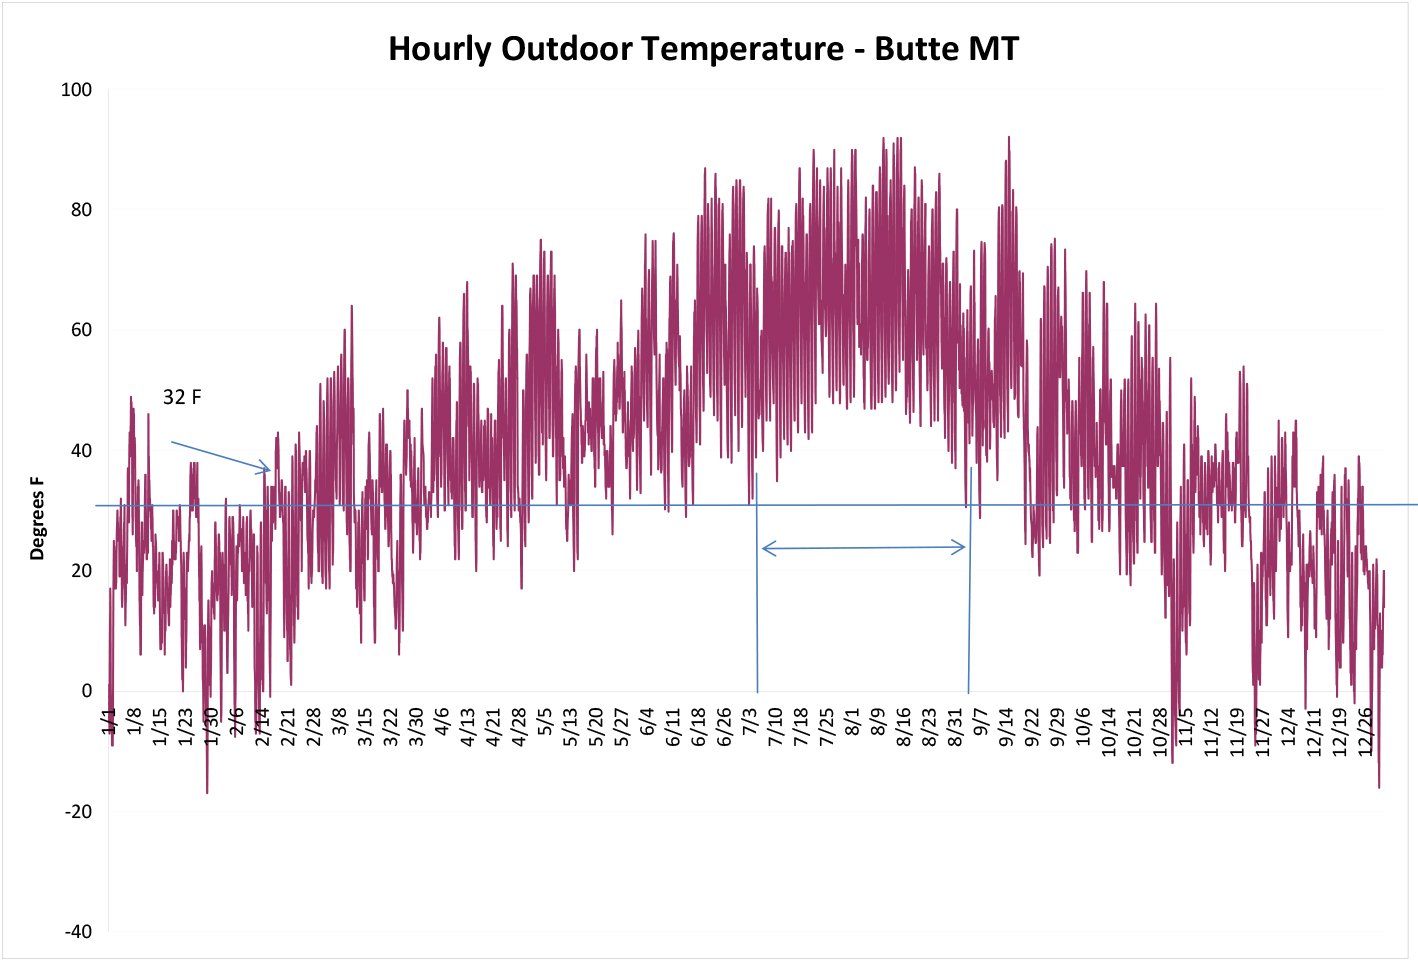
Figure 5. Outdoor Air Temperature for Butte, MT (F). Source: NCAT
The “growing season” in Butte is when the hourly temperature does not fall below 32o F—typically July 1 through September 1, or about eight weeks. When the weather forecast predicts cold temperatures, gardeners in Butte often cover their gardens overnight.
Constructing an inexpensive hoop house will obviously extend the growing season in a cold climate such as Butte. If we look at TMY3 data and ignore all of the hours when the outside temperature is greater than 32o F, and then look at when the solar gain minus the losses is positive, we can see that the greenhouse has a better chance of protecting the plants for a longer growing season (see Figure 6).
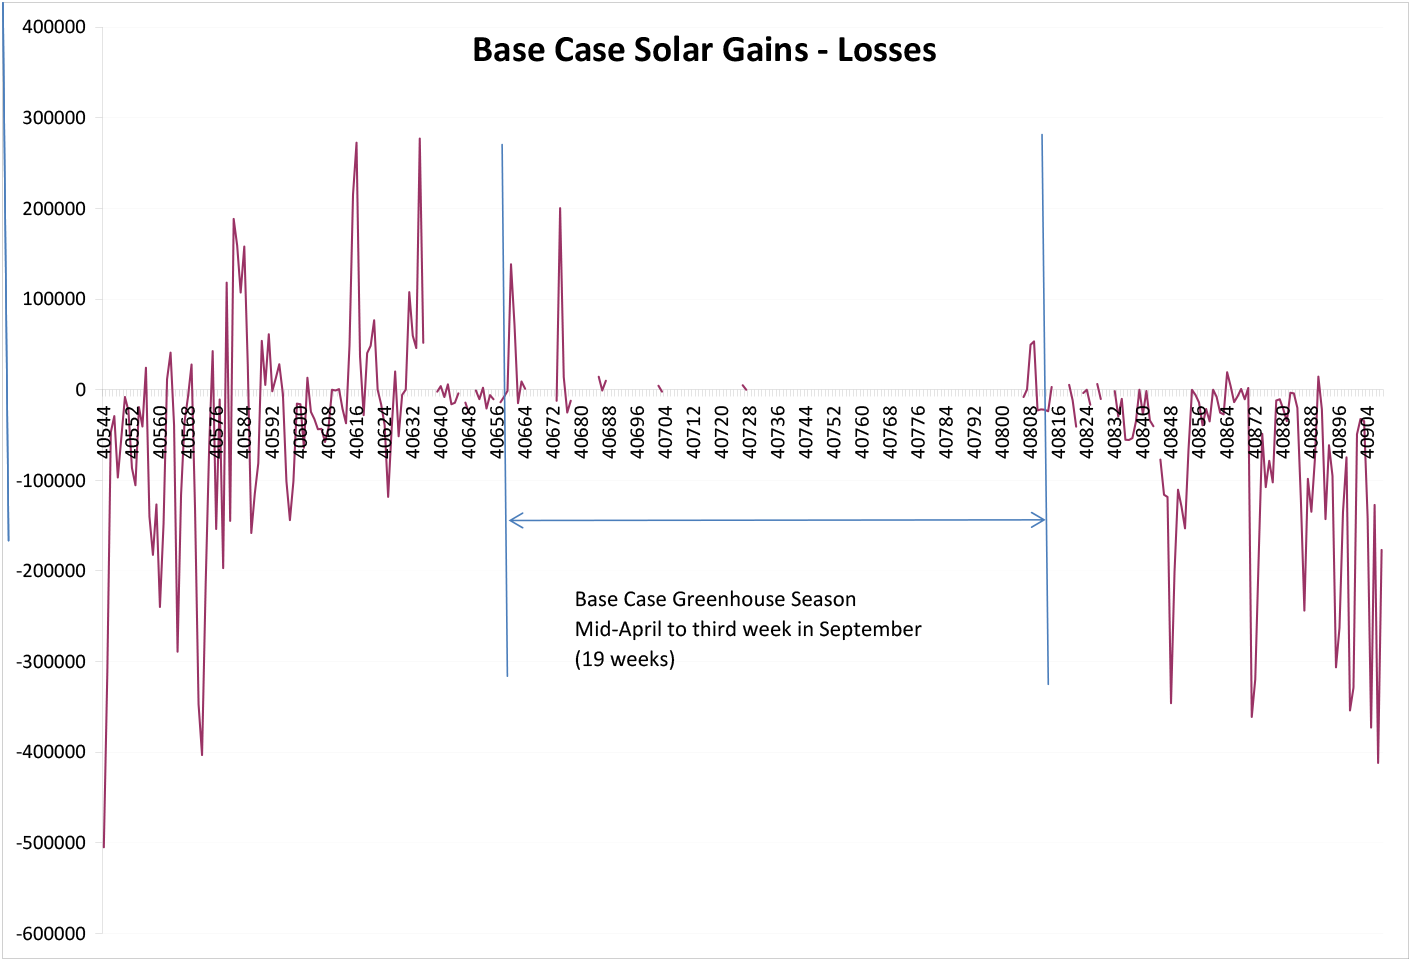
Figure 6. Base Case Solar Gains Minus Losses. Source: NCAT
The growing season can be further extended by building a more robust greenhouse by using twin-wall glazing, insulating the perimeter, and reducing air leakage (see Figure 7).
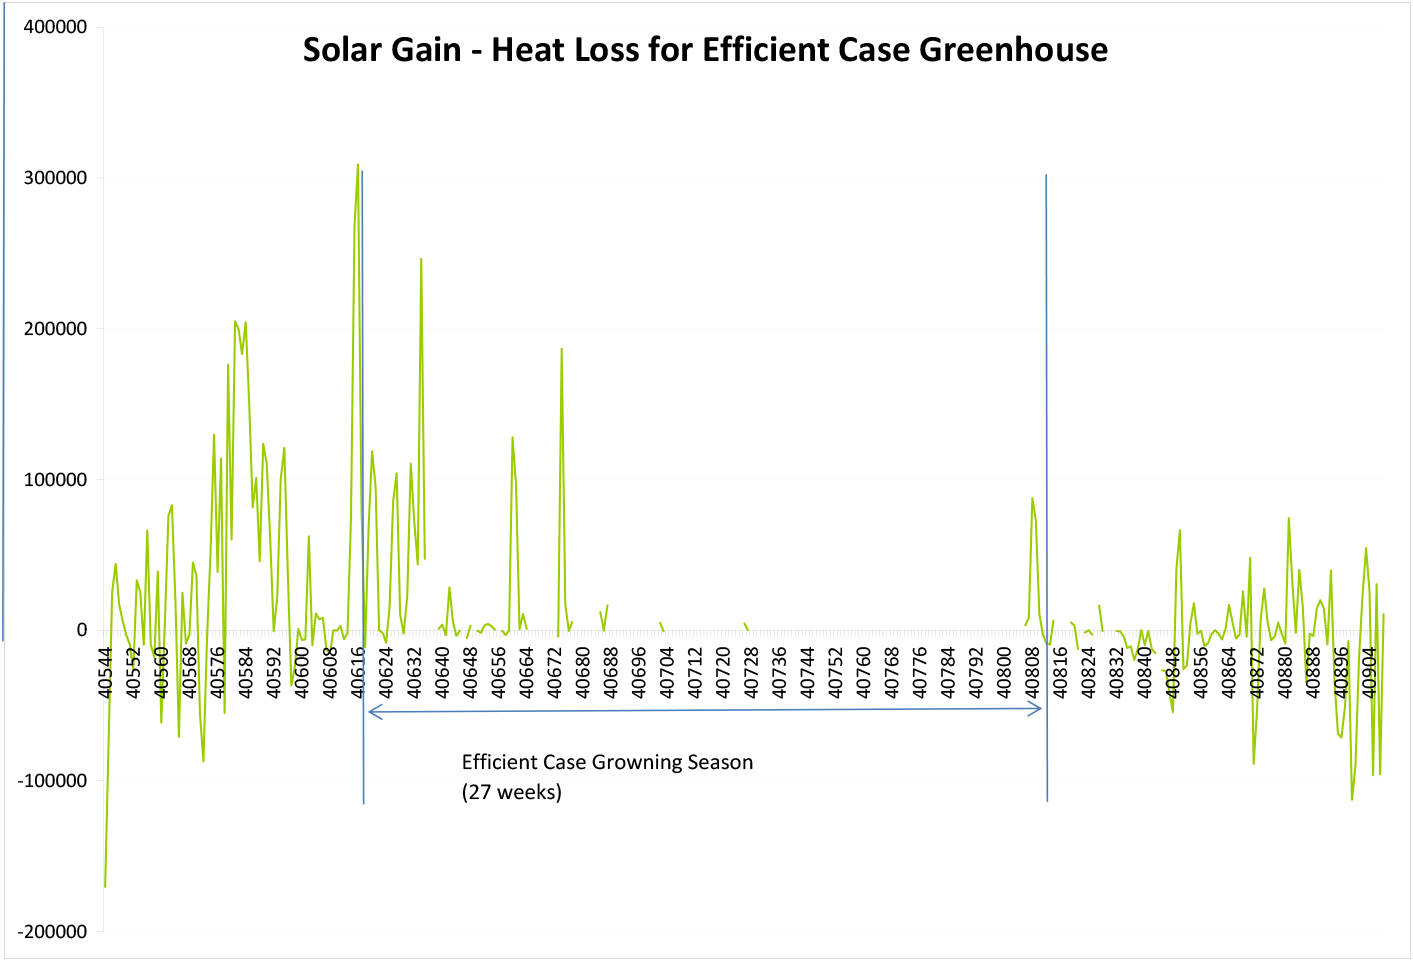
Figure 7. Solar Gain Minus Heat Loss for Efficient Case Greenhouse. Source: NCAT
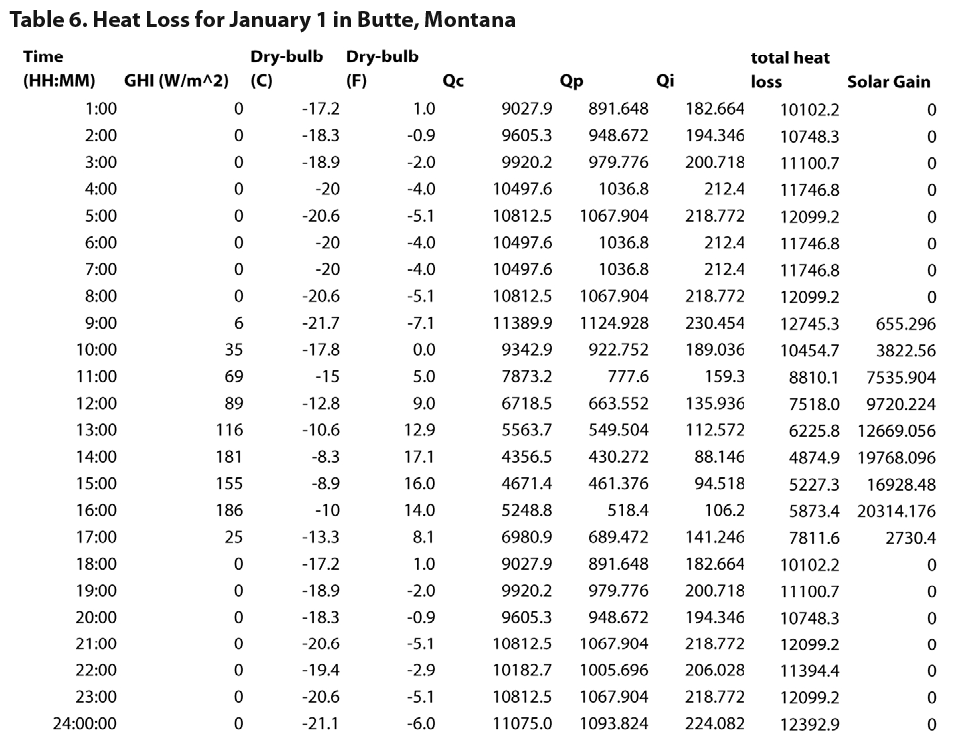
Heating balance for January 1 in Butte, Montana
The solar gain in Butte, Montana on January 1 was charted above. Table 6 shows heat loss for the greenhouse on the same day. As the table shows, it would take two and a half times the solar heat gain to keep the greenhouse from freezing.
Table 6. Heat Loss for January 1 in Butte, Montana
Source: NCAT
Our analysis ignores the thermal storage capacity of the soil, moisture, and tools and equipment in the greenhouse. These materials will act as a sort of thermal battery, helping to smooth out the jagged temperature lines in the charts above.
Heat Storage (Thermal Mass)
Both the materials inside the greenhouse and the soil have thermal mass. This thermal mass gets warm when the sun shines on it and cools off after the sun goes down. Thermal mass in the greenhouse serves to moderate temperatures, keeping the greenhouse cooler in the daytime and warmer at night. Daytime solar gain can create overheating problems even in colder seasons, and if this heat can be absorbed by thermal mass, the mass can act as an energy “battery” and release the heat to the greenhouse at night. Thermal mass concepts have been understood and used in buildings for centuries, but good mathematical treatments of them do not exist. The process is too complex with too many variables to treat simply with computer models. NCAT plans a future study of passive heat storage in greenhouses to determine whether a numerical model of how to predict temperature timing changes in greenhouses could be developed.
Season-extending greenhouses in cold climates cannot rely on water-based systems for heat storage unless they are designed for freeze protection in the winter months. Freeze protection can be time consuming and expensive—water for the greenhouse must be brought into the greenhouse from below the frost line with a frost-free hydrant.
Conclusion
Growing in cold climates is challenging, but season extension techniques can help overcome these challenges and allow a longer growing season. Typical Meteorological Year data can help evaluate different greenhouse designs and model solar heat gain and heat loss from specific designs. By accurately estimating the impact of a particular season extension technique, growers can determine which crops would be best suited to the resulting growing season. Although it is not feasible to extend the greenhouse season to year-around operation without supplemental heating, an inexpensive hoop house with additional insulation and infiltration control has the potential to extend the typical growing season by more than three times the typical cold-climate growing season.
References
Adaptive Materials, Inc. 2011. Solexx Twin-Wall Greenhouses and Greenhouse Covering.
Bellows, Barbara. 2008. Solar Greenhouses. ATTRA National Sustainable Agriculture Information Service. Publication IP142.
Anon (eds). 1978. Joseph Orr’s Fabulous Mud Heat-Storage Solar Greenhouse. Mother Earth News. May-June 1978.
National Renewable Energy Laboratory (NREL). 2008. Photovoltaic Solar Resource: Flat Plate Tilted South at Latitude. U.S. Department of Energy.
National Renewable Energy Laboratory. 2005. National Solar Radiation Data Base: 1991- 2005 Update: Typical Meteorological Year 3. U.S. Department of Energy.
University of Georgia, No date. Greenhouse Coverings. University of Georgia, College of Agricultural & Environmental Sciences.
U.S. National Aboretum. 1990. USDA plant zone hardiness zone description. Excerpted from: USDA Miscellaneous Publication No. 1475, January 1990. U.S. Department of Agriculture.
Wang, Yong-Wei and Xi-Feng Liang. 2006. Performance of underground heat storage system in a double-film-covered greenhouse. Journal of Zhejiang University Science. March 2006.
Wilcox, S. and W. Marion. 2008. User’s Manual for TMY3 Data Sets, NREL/TP-581-43156. April 2008. National Renewable Energy Laboratory, Golden, CO.
Wisconsin Focus on Energy. 2008. Tropical Gardens Sees More Greens. Fact Sheet BP-3182-1008. Wisconsin Focus on Energy.
Further Resources
Websites
High Tunnel Initiative
by USDA National Resources Conservation Service
Information on high tunnels and financial assistance through the Environmental Quality Incentives Program (EQIP).
Frost Protection and Extending the Growing Season by Colorado State University Extension, Colorado Master Gardener Program.
This article different types of coverings to achieve frost protection. It also provides a list of resources for further investigation.
Growing Vegetables in a Hobby Greenhouse by Colorado State University Extension, Colorado Master Gardener Program.
This article discusses season extension, passive solar greenhouses, and cold and warm season vegetables. It also provides a list of resources for further investigation.
Hightunnels.org
This website is staffed by researchers, Extension specialists, professors, growers, and others collaborating to share experiences and knowledge about high tunnels. The website provides many useful resources to growers and educators.
Individual Greenhouse Energy Conservation Checklist (adapted) by John W. Bartok Jr., University of Connecticut; A.J. Both, Rutgers University; and Paul Fisher, University of New Hampshire.
This checklist helps calculate the heat loss in greenhouses based on design features.
Sunspace and Solar Greenhouse Design and Construction by Build It Solar.
This webpage identifies numerous resources related to greenhouse design and construction.
Publications
ASHRAE Handbook of Fundamentals, 2009. By the American Society of Heating, Refrigerating and Air-Conditioning Engineers, Inc., Atlanta, GA.
Available from the author:
ASHRAE
1791 Tullie Circle
Atlanta, GA 30329
800-527-4723
Fax 678-539-2187
mowen@ashrae.org
The ASHRAE Handbooks are the design standard for control of built environments with volumes on Systems and Equipment, HVAC Applications, Refrigeration and Fundamentals.
Building Your Own Greenhouse. 1997. By Mark Freeman. Stackpole Books, Mechanicsburg, PA.
A guide to designing and constructing cold frames, free-standing greenhouses, and attached to the house solar greenhouses. Available from:
Stackpole Books
5067 Ritter Rd.
Mechanicsburg, PA 17055
800-732-3669
High Tunnel Production Manual. 2003. By Bill Lamont and Mike Orzolek. Pennsylvania State University.
This manual provides 18 chapters of useful information on high tunnels, including construction and maintenance, the cropping environment, and heating. Available from:
Dr. Bill Lamont
Department of Horticulture
206 Tyson Building
Penn State University
University Park, PA 16802
Solar Gardening. 1994. By Leandre Poisson and Gretchen Poisson. Chelsea Green Publishing, White River Jct., VT.
This book shows how to increase efforts of the sun during the coldest months of the year and how to protect tender plants from the intensity of the scorching sun during the hottest months through the use of solar “mini-greenhouses.” The book includes instructions for building a variety of solar appliances plus descriptions of more than 90 different crops, with charts showing when to plant and harvest each. The result is a year-round harvest even from a small garden.
Walking to Spring: Using High Tunnels to Grow Produce 52 Weeks a Year. Alison and Paul Wiediger.
This book is based on the authors’ experience growing in high tunnels. It discusses site selection, construction, methods, marketing, and in-depth growing tips for crops. It also includes useful charts and forms for planning, production, and marketing as well as an extensive resource list. Available from:
Au Naturel Farm
3298 Fairview Church Road
Smiths Grove, KY 42171
Sustainable Season Extension: Considerations for Design
By David Ryan, PE
NCAT Energy Engineer
Published September 2011
© NCAT
IP416
This publication is produced by the National Center for Appropriate Technology through the ATTRA Sustainable Agriculture program, under a cooperative agreement with USDA Rural Development. ATTRA.NCAT.ORG.