Organic Pulses Production, Economics, and Marketing
By Andrew Coggins, NCAT Rocky Mountain West Regional Director, and Jeff Schahczenski, NCAT Agricultural and Natural Resource Economist
Abstract
Pulses are leguminous crops that are harvested solely for dry seed. Dried beans, lentils, chickpeas (garbanzo beans), and other dry peas are the most known and consumed types of pulses. This publication covers organic pulse production, economics, and marketing. Organic pulse production differs from non-organic production in important ways, and organic pulses in general are of higher value. Although economists have not fully understood and researched the topic, limited available evidence suggests that producing organic pulses appears to be significantly profitable.
Contents
Overview
Organic Production Management: The Importance of Pulses in Rotations
Weed Management
Disease Management
Pest Management
Fertility Management
Harvesting and Storage
Economics and Marketing
Risk Management
Summary
References
Further Resources
Overview
What are Pulses?
Pulses are leguminous crops that are harvested solely for dry seed. Dried beans, lentils, chickpeas (garbanzo beans), and other dry peas are the most known and consumed types of pulses. Legume crops that are harvested green, such as green peas and beans, are not pulses but classified as vegetable crops. Organic pulses are pulses grown under the USDA organic certification system. Though, globally, pulse crop production acreages are eclipsed by cereal crop acreages, pulse crops remain a key part of the diet in many areas of the world. It should be noted that leguminous crops include clover, which is technically part of the pea family (Fabaceae), but usually used as a green manure or forage, not a dry edible seed.
We are not considering soybeans in this publication even though they fit the technical definition of a legume. Soybeans can also be an oilseed crop, but they aren’t exclusively an oilseed because there are also edible types. In the Midwest, soybeans are often an important part of organic rotations, and they serve a function similar to the pulse crops discussed in this publication.
Production and Value of Organic Pulses
The most recent, consistent data available on organic pulse production and values are provided in a special organic survey that was part of the 2017 U.S. Census of Agriculture, released in 2020 and representing data from 2019 (USDA NASS, 2020). According to one expert, this data is likely an undercount, as most state departments of agriculture do not separately track organic pulse production (Kibiwott, 2021).
The data cover organic chickpeas (garbanzo), dry edible beans (including black, blackeye, great northern, dark red kidney, light red kidney, lima, navy, pinto, and others not listed), dry edible peas (including smooth green peas, yellow dry peas, and other peas not listed), and lentils. The total production of all pulses as defined above was almost 89 million pounds, with a value of production of more than $48 million. Table 1 provides details.
Unfortunately, detailed data by state is only available for chickpeas, dry edible black beans, dry edible pinto beans, and lentils. Tables 2, 3, 4, and 5 provide details for these specific organic pulses.
| Table 1. Total U.S. Organic Production and Value of All Pulses, 2019 | ||||||
| Pulse Type | Farms | Harvested Acres | Quantity (CWT) | CWT per Acre | Value Sold | Value per CWT |
| Chickpeas | 31 | 6,048 | 105,458 | 17.44 | $7,208,415 | $68.35 |
| All Dry Edible Beans | 210 | 26,192 | 428,208 | 16.35 | $29,603,791 | $69.13 |
| All Dry Edible Peas | 104 | 16,666 | 254,890 | 15.29 | $5,903,536 | $23.16 |
| Lentils | 44 | 12,434 | 101,398 | 8.15 | $5,548,642 | $54.72 |
| Total U.S. | 389 | 61,340 | 889,954 | 14.51 | $48,264,384 | $54.23 |
| Source: USDA NASS, 2020 | ||||||
| Table 2. Organic Chickpea Production and Value by State, 2019 | ||||||
| State | Farms | Harvested Acres | Quantity (CWT) | CWT per Acre | Value Sold | Value per CWT |
| Arizona | 4 | NA* | NA* | NA* | NA* | NA* |
| California | 4 | 516 | 6,678 | 12.94 | $402,191 | $60.23 |
| Colorado | 2 | NA* | NA* | NA* | NA* | NA* |
| Idaho | 2 | NA* | NA* | NA* | NA* | NA* |
| Montana | 12 | 1,712 | 23,064 | 13.47 | $1,402,766 | $60.82 |
| Nebraska | 1 | NA* | NA* | NA* | NA* | NA* |
| New York | 3 | 3 | 51 | 17 | $2,985 | $58.53 |
| Washington | 1 | NA* | NA* | NA* | NA* | NA* |
| Wyoming | 2 | NA* | NA* | NA* | NA* | NA* |
| Total U.S.** | 31 | 6,048 | 105,458 | 17.44 | $7,208,415 | $68.35 |
| * Not Available to protect individual data; ** Includes Not-Available data | ||||||
| Source: USDA NASS, 2020 | ||||||
| Table 3. Organic Dry Edible Black Bean Production and Value by State, 2019 | ||||||
| State | Farms | Harvested Acres | Quantity (CWT) | CWT per Acre | Value Sold | Value per CWT |
| Colorado | 2 | NA* | NA* | NA* | NA* | NA* |
| Idaho | 5 | 155 | 3,490 | 22.52 | $270,750 | $77.58 |
| Illinois | 7 | NA* | NA* | NA* | NA* | NA* |
| Iowa | 1 | NA* | NA* | NA* | NA* | NA* |
| Maine | 3 | NA* | NA* | NA* | NA* | NA* |
| Michigan | 42 | 7,185 | 117,088 | 16.3 | $7,828,088 | $66.86 |
| Minnesota | 22 | 2,347 | 28,268 | 12.04 | $1,845,139 | $65.27 |
| Nebraska | 2 | NA* | NA* | NA* | NA* | NA* |
| New Mexico | 2 | NA* | NA* | NA* | NA* | NA* |
| New York | 14 | 490 | 5,614 | 11.46 | $357,509 | $63.68 |
| North Dakota | 2 | NA* | NA* | NA* | NA* | NA* |
| Ohio | 1 | NA* | NA* | NA* | NA* | NA* |
| Oregon | 2 | NA* | NA* | NA* | NA* | NA* |
| Pennsylvania | 1 | NA* | NA* | NA* | NA* | NA* |
| South Dakota | 2 | NA* | NA* | NA* | NA* | NA* |
| Tennessee | 2 | NA* | NA* | NA* | NA* | NA* |
| Vermont | 1 | NA* | NA* | NA* | NA* | NA* |
| Washington | 3 | NA* | NA* | NA* | NA* | NA* |
| Wisconsin | 1 | NA* | NA* | NA* | NA* | NA* |
| Total U.S.** | 118 | 12,768 | 189,924 | 14.88 | $12,467,384 | $65.64 |
| * Not Available to protect individual data; ** Includes Not-Available data | ||||||
| Source: USDA NASS, 2020 | ||||||
| Table 4. Organic Dry Edible Pinto Beans Production and Value by State, 2019 | ||||||
| State | Farms | Harvested Acres | Quantity (CWT) | CWT per Acre | Value Sold | Value per CWT |
| Colorado | 15 | NA* | NA* | NA* | NA* | NA* |
| Idaho | 5 | 194 | 4,217 | 21.74 | $307,910 | $73.02 |
| Kansas | 1 | NA* | NA* | NA* | NA* | NA* |
| Maine | 1 | NA* | NA* | NA* | NA* | NA* |
| Michigan | 7 | 632 | 7,149 | 11.31 | $485,255 | $67.88 |
| Minnesota | 2 | NA* | NA* | NA* | NA* | NA* |
| Nebraska | 5 | 1,346 | 23,988 | 17.82 | $1,530,416 | $63.80 |
| New York | 4 | 149 | 3,363 | 22.57 | $224,095 | $66.64 |
| North Dakota | 3 | 820 | 13,840 | 16.88 | $854,074 | $61.71 |
| South Dakota | 1 | NA* | NA* | NA* | NA* | NA* |
| Tennessee | 2 | NA* | NA* | NA* | NA* | NA* |
| Utah | 1 | NA* | NA* | NA* | NA* | NA* |
| Washington | 2 | NA* | NA* | NA* | NA* | NA* |
| West Virginia | 1 | NA* | NA* | NA* | NA* | NA* |
| Wisconsin | 1 | NA* | NA* | NA* | NA* | NA* |
| Total U.S.** | 51 | 8,115 | 153,079 | 18.86 | $10,630,447 | $69.44 |
| * Not Available to protect individual data; ** Includes Not-Available data | ||||||
| Source: USDA NASS, 2020 | ||||||
| Table 5. Organic Lentil Production and Value by State, 2019 | ||||||
| State | Farms | Harvested Acres | Quantity (CWT) | CWT per Acre | Value Sold | Value per CWT |
| Colorado | 2 | NA* | NA* | NA* | NA* | NA* |
| Idaho | 2 | NA* | NA* | NA* | NA* | NA* |
| Minnesota | 2 | NA* | NA* | NA* | NA* | NA* |
| Montana | 26 | 9,516 | 81,755 | 8.59 | $4,453,275 | $54.47 |
| New York | 3 | 3 | 30 | 10 | $1,506 | $50.20 |
| North Dakota | 8 | 1,811 | 12,994 | 7.18 | $727,760 | $56.01 |
| Wyoming | 1 | NA* | NA* | NA* | NA* | NA* |
| Total U.S.** | 44 | 12,434 | 101,398 | 8.15 | $5,548,642 | $54.72 |
| * Not Available to protect individual data; ** Includes Not-Available data | ||||||
| Source: USDA NASS, 2020 | ||||||
There are several summary points that this data can provide regarding organic pulse production:
1. There are very few producers of organic pulses in the United States. However, demand appears to be increasing (see Table 6), with production increasing from 513,782 cwt to 889,954 cwt between 2016 and 2019 (almost 58% increase). There seems to be room for expanding production.
2. Although there are many pulse growers in a fairly diverse set of states, production of most organic pulses occurs in just a few states, depending on the pulse. Lentil production is dominated by pulse farmers in Montana and North Dakota. Montana producers also lead in chickpea production. Organic black bean production is concentrated in Michigan, Minnesota, and New York. Colorado seems dominant in pinto bean production.
3. Yields per acre seem to vary significantly from average yields across the types of pulses grown in different states.
4. Prices do not vary too significantly across types of pulses in the various states where they are grown.
Organic Production Management: The Importance of Pulses in Rotations
The principal drivers of rotation design are weed, pest, and disease control, and the nutrient needs of the different crops in the rotation. The key difference between non-organic and organic rotations is that non-organic are not usually as complex because synthetic fertilizers, herbicides, fungicides, and insecticides can help mitigate some shortfall in nutrients, disease, pest attack, and weed pressures.
One consequence is that the non-organic approach may be more costly, and this often forces a short-term perspective, although the long-term effects on soil health may be more problematic. In fact, in many instances, non-organic systems may lead to poor soil health, less soil microbial activity, and increased soil acidity in places where acid soils are already an issue in crop production (Jones et al., 2019). Because of the generally more complex rotations with organic systems, it is more important to highlight the part that legumes and pulses play within the whole system, rather than to concentrate specifically on their independent value.
For example, successful organic farmers Doug and Anna Jones Crabtree and Rick Clark have related the need to secure markets ahead of any cash crop grown organically. The Crabtrees are based in northcentral Montana and Clark is from Indiana, so the issue of markets seems to transcend location. Choosing to include pulses in a rotation may have as much to do with a secured market as it does with their N-fixing properties and other benefits. Nonetheless, legumes in general are often integral to organic system fertility management.
The motivations to move from non-organic growing systems to organic systems are varied. Recent research led by NCAT and based on a nationwide sample suggests that ecological sustainability, higher-quality products, reduced exposure to pesticides, higher prices for products, and rising consumer demand for organic products all factored almost equally as reasons to adopt an organic production system (Morris et al., 2019).
There are many variations of crop rotations across all systems, but the most balanced and well-thought-out organic rotations, which include pulse crops, are often grown simply because organic farmers are not allowed to use synthetic fertilizers. Also, a main feature of all organic rotations includes the use of cover crops. Often, organic farmers will use cover crop mixes of multiple species (usually including legumes) because of their N-fixing properties and their potential to build soil organic matter.
Examples of rotations that include cover crops, from two very different areas of the country, are again represented by Rick Clark in Indiana and Doug and Anna Jones Crabtree in Montana. They all cite rotations and cover crops as key tools in the armory for sequestering nutrients and carbon, increasing pounds of biomass, encouraging healthy microbial and insect populations, reducing soil erosion, retaining soil moisture, and aiding in weed, pest, and disease control. There are three key areas where these two examples differ in achieving these outcomes: 1) the complexity of the rotation; 2) their approach to tillage; and 3) cover crop use.
Rick Clark currently (2020) grows one pulse crop within a five-crop rotation of corn, soybeans, wheat, peas, and alfalfa; and complex cover crops mixes to feed the cash crops. His case is informative because he is considering including other pulse cash crops in his rotation. The cover crops are actively growing and supporting the cash crops in the year of production: corn being sown into live Fixation Balansa clover and Austrian winter peas; soybeans being sown into live cereal rye, along with residue from naturally terminated warm-season cover crops; and live cereal rye being roller-crimped (terminated) after the soybeans have been sown.
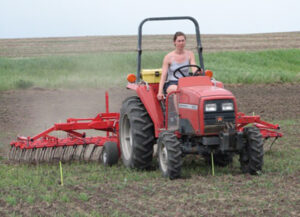
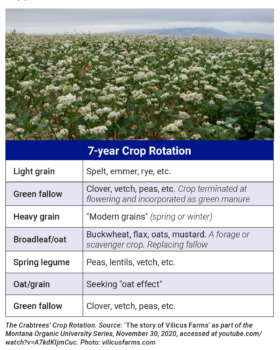 Doug and Anna Jones Crabtree also grow legume cover crops but within a seven-year rotation and, unlike Rick, cover crops are not grown in the same year as a cash crop, but separately, in lieu of a summer fallow when the field is rested from production. So, the Crabtrees’ rotation practice is based around a crop type rather than a specific variety, including spring-sown legumes (as illustrated below). Doug and Anna terminate cover crops and use tillage to incorporate the residue as green manure, whereas Rick terminates his cover crop with a roller-crimper rather than tillage. It is important to note that the Crabtrees use pulses as a green manure and as a cash crop in their complex rotation system. However, they incorporate the residue with tillage after harvesting the pulse crop.
When asked about growing cover crops in the same production year as a cash crop, Doug replied that they had not been successful in establishing a cover crop after harvest of a previous cash crop, speculating that they might be too far north to establish before harsh weather or might not have found the right species yet (Montana Organic Association, 2020). He seemed comfortable resting fields for a full season and building up soil health and a nutrient base, so this was not an immediate issue. Unlike Rick, Doug also believes controlled low-intensity tillage is both desirable and necessary, including moldboard plowing, as this can be the most reliable means of terminating sod and incorporating residue for fields coming out of their rest periods.
Doug’s annual precipitation north of Havre, Montana, near the Canadian border is about 11 inches per year, and Rick’s annual precipitation in Warren County, Indiana, is about 28 inches per year. This is but one example of how climatic variation between different geographic areas often necessitates different approaches to organic crop production.
Weed Management
“Weed management in pulses is of particular importance as these crops are generally considered to be poor competitors due to their slow establishment and limited vegetative growth.”—Montana Cool-season Pulse Production Guide (McVay et al., 2013).
One method of weed management is to plant a cover crop cocktail immediately after the cash crop is harvested. With the right mix, some cover crops can overwinter and grow in the spring, therefore providing consistent ground cover into winter, weed suppression, and storage of nutrients that will be released for the subsequent cash crop when the cover crop is terminated.
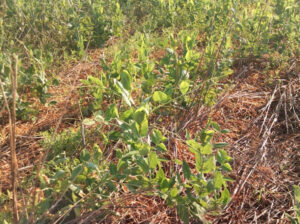
Peas growing through a previous crop residue—possibly corn residue—at Menoken Research farm near Bismarck, North Dakota, 2017. Both cash crop and residue provide weed suppression. Photo: Andrew Coggins, NCAT
Clark has been using cover crops and no-till systems for 12 years (as of 2020), planting organic soybeans into growing cereal rye and then roller-crimping the rye and planting certified organic corn into a cover crop of Balansa Fixation clover and Austrian winter peas. Continual weed control is achieved by the cover crop up to the point of termination, and then taken over by a combination of the cover crop residue covering the ground and a rapidly growing cash crop. David Brandt, from Fairfield, Ohio, has also been using this no-till technique for some 40 years or more, again using cereal rye (essentially a winter grain crop) as a fertilizer base for a soybean cash crop.
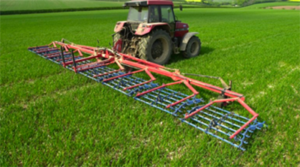
Where cover crops are not planted, weed suppression can also be aided by planting into a previous crop’s residue as a mulch (see photo). Of course, another method for weed management is use of mechanical weeders, which will drag tines between the crop rows and ‘hoe’ weeds out. These machines can be equipped with cameras that keep the machine aligned between the rows, using hydraulic rams to move the whole frame from side to side. Three machines using the camera technology are currently (2021) available in the United States, made by Garford (England), Robovator (Denmark), and Steketee IC (Netherlands – pictured below).
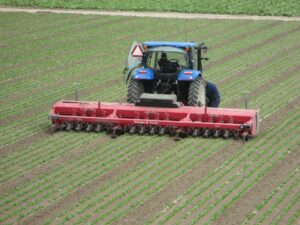
The Skeketee IC Weeder. Photo: growingproduce.com
Such machines can either be equipped with cameras that keep the machine aligned between the rows or take advantage of tractor satellite steering systems, which will serve the same purpose. These are particularly useful for working through a crop at speed, even if there is only a narrow space between the crop rows, as illustrated. This approach is only useful in the early stages of crop emergence, when the crops are low to the ground and before pulse crops, like peas, begin to fill in between the rows.
Early versions of Garford weeders in the UK offered various narrow, medium, or broad tines that could be fitted to cover the gaps between different sowing widths, and soil disturbance is generally minimal. Effectiveness varied depending on the type of weeds one was trying to control (wild oats and other grass weeds can be especially challenging) and the type and condition of the soil. Heavy, dry soils were hard to penetrate, making weed removal difficult. Current versions of all three machines are reviewed in an article in Growing Produce (Smith, 2018).
Harrows weeding wild oats in tame oats. Photos: P. Shirtliffe, University of Saskatchewan,
Department of Plant Sciences
Non-selective tines weeding wild oats in tame oats. Photos: P. Shirtliffe, University of Saskatchewan, Department of Plant Sciences
A cheaper alternative to inter-row weeders is sets of harrows or light tines that lightly comb the crop once it is established, removing some weeds while leaving the crop itself undamaged. This is only partially effective because if the weeding action is too aggressive it will result in crop damage.
Steven Shirtliffe (University of Saskatchewan, Department of Plant Sciences) has been doing work on mechanical wild-oat control within tame oats, using harrow sets that non-selectively weed the whole area to reduce the weed burden, as shown in the photos above. Pat Carr (Montana State University, Central Agricultural Research Center) and Zach Miller (Montana State University, Western Agricultural Research Center) have also been researching mechanical control of Canada thistle and field bindweed, both in Montana and Manitoba, for crops of alfalfa and peas.
Disease Management
Crop rotation within organic systems, including pulses, is an integral part of controlling diseases, taking account of crop types (grains, oilseeds, pulses, forage crops, other legumes such as clover, etc.), as well as pest and weed control. Diseases such as Ascochyta, Pythium, Anthracnose, Botrytis, and Sclerotinia can affect many types of pulse crops, such as chickpeas, peas, beans, lentils, fava beans (field beans, broad beans, etc.). Sclerotinia also affects sunflowers, mustard, and canola (oilseed rape), and has long dormancy periods in the soil. Seed and root rot are significant problems in organic chickpea production. There are very few products available for use in organic production, and the success of these products is largely inconsistent (Kibiwott, 2021).
These issues demonstrate why rotations should include different crop types to break disease cycles. Botrytis (called chocolate spot on fava beans) is also found on many pulse crops, and this can transfer to oilseeds such as sunflowers and flax.
Climates with high precipitation or high humidity can increase the risk of disease attack. The principles behind disease, pest, and weed control in organic systems remain the same regardless of climate or geographical location: crop rotation with gaps between pulses and oilseeds, quality seed selection for planting, healthy soils, and healthy biodiversity.
Pest Management
In non-organic systems, pest management usually comes in three forms: (1) with chemical coatings on treated seed to protect the seed from pest and disease attack through the early stages of germination; (2) throughout the growing season with a series of contact and systemic insecticides as needed; and (3) in the use of GMO seeds with insecticides expressed within the plant.
An example of what can be loaded onto a pulse crop seed (in addition to inoculant as described below) is CruiserMaxx® Vibrance® from Syngenta, containing thiamethoxam (insecticide) and thiabendazole, sedaxane, mefenoxam, and fludioxonil (fungicides). This seed treatment protects against damage from insects and soil- and seedborne diseases of dried shelled peas. The growing consensus from researchers is that both predator and prey suffer from this practice, the ecosystem suffers, financial costs can increase, and soil health often suffers (Gunstone et al., 2021).
Aside from bacterial inoculant, the whole principle behind pest management of pulses in organic systems is to take a completely different approach from non-organic methods. Enhancing soil health and encouraging biodiversity naturally builds up a population of predators to control the pest problem. Again, to quote Rick Clark, Warren County, Indiana:
This farm is heading towards balance. Balance between predator and prey, and balance between bacteria and fungi. When you take away the insecticides and the seed treatments, all these things that are killing the beneficial species, you take all those away and we are heading towards balance. And now I can plant non-GMO corn or organic corn. (Hora, 2020)
Fertility Management
Like all other crops, pulse crops must be carefully weaned off synthetic fertilizer in the transition from non-organic to organic systems. As legumes with the ability to fix N, pulse crops require little additional N fertilizer: in the region of 10 to 20 pounds per acre for field peas, chickpeas, and lentils—an amount that will be available already in the soil (North Dakota State University Extension, 2019).
However, nodulation can take three to four weeks after germination to appear on the root systems (when rhizobia bacteria enter the root systems and form nodules; the rhizobium converting N2 gas into NH4 ammonium, which is available to plants). So, it is common practice to treat most pulse crop seeds – both non-organic and organic – with inoculant containing rhizobium bacteria, to ensure that there are enough bacteria within the vicinity of the plant to allow successful nodulation. For certified organic production, it is critical that the inoculant used not be GMO. Pulses also need supplies of P (in particular) for root growth, uniform maturity, stress tolerance, and N fixation, as well as K, S, and other micronutrients.
In established organic systems, with well-balanced and healthy soils, most of these nutrients should be available within the soil in sufficient amounts. However, before growing any organic pulse or other crop, it is always worth referencing several key indicators, including the likely nutrient removal by the previous cash crop, the nutrient requirements of the proposed crop, and the present nutrient balance and availability in the soil, by taking a soil test and having it analyzed. The basic Haney test ($50 to $55), for example, includes an estimate of N:P:K nutrient availability for the following crop, which is helpful in organic systems (Bellows et al., 2020). This test will help growers decide whether their soils need additional nutrients supplied from termination of warm/cold season cover crops.
Harvesting and Storage
The basic process of harvesting organic pulses is similar to non-organic pulse harvesting, except that in non-organic production, many growers desiccate with an herbicide to make harvest easier. Organic growers generally swath to attain uniform moisture and to let (green) weeds dry prior to harvest. The swathed pulses can either be picked up with a combine and header, or a combine and a pickup reel. Combines tend to work best with a consistent feed of crop into the machine. However, if a 12-to-14-foot swath is cut and center-stacked into a 4-foot swath, a 4-to-5-foot pickup reel would be best for the combine. Again, the advantage of swathing is that the crop is already cut, so you don’t need either the knives on a conventional header or 30 to 40 feet of width, and there is more even ripening and a gentler harvest action with less seed shatter. The downside of swathing is that if it rains on a swath, moisture can build up underneath, and you cannot turn this swath as you would hay to enhance drying.
Applying an herbicide could make harvest faster, easier, and more efficient, but it is not allowed under certified organic production. Not using these herbicides does mean, however, that consumers are less likely to be exposed to potentially harmful herbicides.
Storage of organic pulses is similar to non-organic production. For storage, the pulse crop needs to be cleaned to remove weed seeds and other material, such as insect remains (for example, grasshopper carcasses). Cleaning seed prior to storage helps to avoid quality loss.
Economics and Marketing
Market Prices
Table 6 provides some data for organic pulses in the United States in 2019. Fortunately, a similar survey released in 2017 offers a means to compare prices for some pulses between these two time periods.
| Table 6. Organic Pulse Crops – 2016 & 2019 | ||||||||||||
| Crop | Farms 2016 | Farms 2019 | Harvested Acres 2016 | Harvested Acres 2019 | Harvested Quantity (cwt) 2016 | Harvested Quantity (cwt) 2019 | Quantity Sold (cwt) 2016 | Quantity Sold Quantity (cwt) 2019 | $ of Value Sales 2016 | $ of Value Sales 2019 | Price/cwt 2016 | Price/cwt 2019 |
| Chickpeas (Garbanzo), ALL | 16 | 31 | 2,664 | 6,048 | 33,963 | 105,458 | 21,118 | 105,458 | $1,310,579 | $7,208,415.00 | $62.06 | $68.35 |
| Dry Edible Beans, ALL * | 235 | 210 | 26,261 | 26,192 | 395,647 | 428,208 | 371,643 | 428,208 | $27,688,836 | $29,603,701.00 | $74.50 | $69.13 |
| Lentils | 21 | 44 | 4,338 | 12,434 | 36,162 | 101,398 | 36,162 | 101,398 | $2,001,193 | $5,548,642.00 | $55.34 | $54.72 |
| Peas, All Dry Edible ** | 56 | 104 | 5,238 | 16,666 | 90,232 | 254,890 | 84,859 | 254,890 | $2,086,776 | $5,903,536.00 | $24.59 | $23.16 |
| Totals | 328 | 389 | 389 | 61,340 | 556,004 | 889,954 | 513,782 | 889,954 | $33,087,384 | $48,264,294.00 | $64.40 | $54.23 |
| *black, blackeye, great northern, dark red kidney, light red kidney, lima | ||||||||||||
| ** smooth green, yellow, austrian | ||||||||||||
In examining Table 6, it is important to first note how few organic farms were growing pulses. The organic pulse market was quite small from a national perspective. Also, the organic dry edible bean market was far more developed than other pulses. The average price for all the organic pulses was $0.64 per pound in 2016, dropping to $0.54 in 2019. Dry pea prices were significantly lower than other pulse crops.
| Table 7. Non-Organic Dry Beans, Peas, and Lentils, July 2021 | |
| TYPE | $/Cwt |
| Kidney Beans | $45.00 |
| Black Beans | $40.71 |
| Chickpeas (Garbanzo) | $34.33 |
| Great Northern Beans | $30.00 |
| Navy Beans | $36.25 |
| Pinto Beans | $36.98 |
| Lentils | $31.67 |
| Green Peas | $13.88 |
| Yellow Peas | $16.47 |
| Source: USDA AMS, 2021 | |
Comparing the average prices of all organic pulses from this survey with the non-organic pulse market in 2019 (Table 7) suggests that organic pulses in 2019 in general commanded more than twice the price of non-organic pulses in 2021. This is a typical situation for many organic crops. However, higher organic market prices often are the result of three factors:
First, the cost of organic pulse production might be higher relative to non-organic pulse production, thus causing market prices to be higher. This topic is discussed in more detail below.
Second, the aggregate demand for organic pulses may have been higher than available aggregate supply for organic pulses. This, too, is a situation common in organic crop markets, where demand for organic crops and livestock often outpaces available supply.
Finally, consumers may be willing to pay more for an organic product that they perceive to be healthier or result in less environmental damages than a comparable non-organic product. There often appears to be willingness on the part of some consumers to pay more for certified organic products.
Cost of Production
There are extremely limited studies of the costs of production of organic pulses and very few of organic crops generally. There are many more non-organic cost-of-production studies, but even these studies quickly become dated, vary significantly by location, and are not consistent with what is included and not included as a cost of production. For a lengthier discussion of these issues, see the ATTRA publication Understanding Organic Pricing and Costs of Production.
Example from Non-Organic Dry Pinto Bean Production
A fairly recent (2019) study of the costs and return estimates of non-commercial dry bean production offers a starting point for exploring the cost of production of organic pulses more generally. The goal of this study was to “provide the Idaho agricultural industry with an unbiased and consistently calculated estimate of the cost of producing various crops and track the change in production costs per acre and per unit over time” (Westerhold, 2019). In meeting this goal, the authors create a “model farm” and utilize economic costs of inputs based on data collected from agriculture supply companies in Idaho. The important point is that this is not actual data from actual farms.
| Table 8 . Costs Per Acre to Produce Dry Beans (Pinto), South Central Idaho, 2019 | |
| Operation Costs | Cost/Acre |
| Seed | $45.00 |
| Fertilizer (all synthetic) | $58.50 |
| Pesticide | $38.13 |
| Fertilizer application | $7.25 |
| Cutting/windrowing | $32.00 |
| Combining | $44.20 |
| Irrigation | $94.43 |
| Crop insurance | $22.00 |
| Bean cleaning and storage | $40.30 |
| Dry bean assessment fee | $2.08 |
| Labor | $68.47 |
| Machinery | $54.98 |
| Interest on operating capital @7% | $13.49 |
| Total operating capital/acre | $521.14 |
| Cash overhead costs | |
| General | $13.00 |
| Land rent | $275.00 |
| Management fee | $42.00 |
| Property taxes | $- |
| Property insurance | $1.71 |
| Investment repairs | $- |
| Total cash overhead costs/acre | $331.71 |
| Total cash costs/acre | $852.84 |
| Non-cash overhead | |
| Capital recovery on equipment | $61.06 |
| Total non-cash overhead/acre | $61.06 |
| Total cost/acre | $913.90 |
| Source: Westerhold, 2019 | |
The model farm used for this analysis is a 2,200-acre farm with 150 acres in dry beans, 550 acres in potatoes, 550 acres in sugar beets, 400 acres in corn or alfalfa, and 550 acres in grain. This is also an irrigated farm. The acreage dedicated to dry beans is plowed in the fall and roller-harrowed twice in the spring before planting and then cultivated for weeds twice during the growing season. These non-organic production practices may or may not be similar for organic dry bean production in Idaho or other locations.
Also, the analysis assessed labor costs between $17.55 and $22.50 per hour, depending on the specific tasks, and included additional overhead labor costs. A general management fee was calculated at 5% of total production costs. Machinery costs related to dry bean production included hourly operating and ownership costs, capital, land, and general overhead costs. Operating capital was charged at a nominal rate of 7% for time used. Intermediate capital (primarily equipment) was charged at a nominal rate of 6.7%, and a general overhead rate of 2.5% of operating costs is included to cover unallocated whole-farm costs (office expenses, legal and accounting expenses, etc.). The results of the analysis are provided in Table 8.
Given the costs estimated in this study for 2019 and using the study’s expected price of $26 per hundredweight (cwt) with a yield of 26 cwt per acre, these 150 acres of pinto beans would have generated a value of only $676 per acre and thus a net economic loss of -$237.90 per acre. However, if we use the current (July 2021) national non-organic pinto price of $36.98 per cwt (from Table 7), then the per-acre value would have been $961.48 per acre, for a net economic gain of $47.58 per acre. It is important to note that the $26 per acre price used in this study was chosen because it was an historical average price for pinto beans. Here we see that the issues of changing input costs, expected price, and expected yield matter greatly and can change significantly from year to year.
Exploring Organic Dry Bean (Pinto) Production Costs
Since we do not have cost estimates available for organic pulse production, we can explore possible differences in organic costs by adjusting items in Table 8 to see how producing organically may differ from non-organic production.
First, what yield expectations might change if dry pinto beans in Idaho were grown organically? If we look at Table 4, we can see that in Idaho in 2019, the average yield of the five organic pinto bean producers was 21.74 cwt per acre. This is a lower yield than the historical average yield of 26 cwt per acre used in the Idaho study. However, the actual average yield of dry pinto beans in 2019 was estimated to be 24.9 cwt per acre (Idaho Agriculture Statistical Bulletin, 2020), which is still lower but not as different from the reported organic yield. Thus, if we were to assume the exact same costs for organic as non-organic pinto bean production and use the 21.74 cwt per acre yield, but the higher $73.02 per cwt organic price in Table 4, then the value of organic pinto beans in Idaho would be $ 1,587.45 per acre, for a net economic gain of $673.55 per acre. This is significantly higher return than non-organic pinto production in Idaho. However, it’s important to consider whether the costs of organic production are likely to be the same, higher, or less than non-organic production.
Looking at Table 8, one could assume that operational costs related to seed, crop insurance (because of higher value of crop insured), and possibly fertilizer (say manure or non-synthetic options) may be higher for organic beans. On the other hand, pesticide costs may be lower. However, potential fungus and insect pest problems without some organic prevention alternative could mean higher yield risks for organic production.
Labor, management, and machinery cost differences between the systems are difficult to assess. Given that that the non-organic production practices that underlie machinery costs in the case study above include spring plowing, two passes of a roller harrow prior to planting and applications of insecticide and fungicides, only the machinery and labor costs of weeding under the organic system would likely need to be accounted for.
Labor and management costs could also differ in that the added weeding would likely result in greater labor costs; however, that could be offset by less labor in pesticide and fungicide applications. The management fee assessed is somewhat arbitrary, being calculated by simply multiplying total operational costs by 5%. Is organic or non-organic production easier to manage, and, thus, should this management cost be different between systems?
Profitability
From the analysis above, it would seem that organic pinto bean production is likely to be more profitable than the non-organic alternative, given the cost assumptions, yield differences, and the significantly higher prices available for organic pinto beans in 2019. However, without actual data from comparable real farms, this is a reasonable but tentative assertion.
A recent (2021) six-year field-scale study experiment in Canada does provide some additional information on relative organic profitability, based on actual data. This study hypothesized that “lower tillage intensity and more diversified crop rotation will result in greater profitability compared to traditional high tillage intensity and a simplified crop rotation, and that the combination of tillage reduction and a diversified crop rotation will further enhance farm profitability through a synergistic effect” (Buwani et al., 2021). This study only looked at differences within organic production systems and did not compare them to non-organic systems. However, the study compared 12 different crop sequences of varying tillage intensity and rotational diversity, and it included the use of two pulses: forage peas and lentils.
The results of this six-year study confirmed that more complex crop rotations do result in greater farm profitability. However, reducing tillage intensity—and even combining reduced tillage intensity with greater crop rotation diversity— did not lead to improved farm profitability. As the authors state, “Because profitability was positively linked to higher tillage intensity, profitability may come at the expense of soil health” (Buwani, et al., 2021). Of course, this conjecture is itself open to question because it assumes that high tillage intensity per se always results in reduced soil health. The ATTRA publication Reducing Tillage Intensity in Organic Production Systems provides more information about this topic. Suffice it to say that the proper level of tillage in both organic and non-organic production systems is a very complex issue and one that is not open to simple answers.
Finally, the authors of this study point out that choosing rotation crops with high price levels could help to mitigate the impact of lower yields that result from uncontrollable factors such as weather. Thus, perhaps using an organic pulse crop that has demonstrated a consistently higher price than another pulse crop in a given rotation may lead to greater profitability.
Buyers of Organic Pulses
Though organic pulse production has been expanding, there are still limited buyers of organic pulses. Indeed, in general, organic farmers need to spend a great deal of time establishing buyers for their products at the prices that provide profitability. Much organic pulse production is under contract. It is important for producers to fully understand the conditions of a contract. As discussed below, establishing an organic pulse contract with a buyer in advance of planting can also help in obtaining crop insurance that covers the generally higher value of organic pulses. Some buyers of organic pulses are listed in the Further Resources section at the end of this publication.
Risk Management
Risk in agriculture is often described as falling into five broad categories:
1. Production risk, deriving from the uncertain natural growth process of crops and livestock, as affected by weather, disease, pests, and other factors.
2. Price or market risk, based on uncertainty about market prices and the costs of “inputs,” such as fertilizers and pesticides.
3. Financial risk, arising from borrowing, interest rates, and debt.
4. Institutional risk, related to taxation and other government actions.
5. Human or personal risk, related to health, accidents, death, divorce, and strain on personal relationships.
In this publication, only production risk and price or market risk are discussed. These two risks are often associated with the federal crop insurance program administered by the USDA Risk Management Agency (RMA) and the income support programs called the Agriculture Risk Coverage (ARC) and Price Loss Coverage (PLC) programs administrated by the USDA Farm Service Agency (FSA). The ARC and PLC programs are of limited value to organic pulse producers, as they only provide support based on non-organic values. These programs are not covered in this publication.
Crop Insurance Options
Federal crop insurance provides both revenue and yield-risk protection for what RMA broadly refers to as “dry beans and dry peas policies.” All federal crop insurance policies provide public subsidy of the cost of the premiums. In 2021, about 62% of federal crop insurance premium costs were supported by public dollars (USDA RMA, 2021).
Yield risk protection, also known as “multiple-peril” insurance, insures against losses from general adverse weather conditions, such as flood, drought, and wind, but also from losses due to insects or plant diseases. Also included are losses due to earthquake, volcanic eruption (a real issue in Hawaii and Alaska), wildlife, and fire.
Revenue-based policies include coverage of the same multiple-peril losses that impact yield but also losses due to market price changes. Because revenue is equal to price times yield, revenue policies are often preferred because they are inclusive of both categories of risk. However, revenue policies do not insure against the risk of changes in the prices of critical inputs, such as fertilizers or fuels.
Finally, there is one additional type of crop insurance protection available to organic pulse growers, called Whole-Farm Revenue Protection (WFRP). This policy provides revenue protection for all crop and livestock products produced by a farm or ranch. Instead of insuring a single product, WFRP insures up to 85% of the adjusted historic average revenue generated by the farm or ranch, based principally on historic tax records. It is the first crop insurance policy that can be purchased anywhere in the United States. The details of WFRP are not covered in this publication; suffice it to say that WFRP could be explored, particularly if no alternative single-pulse-crop alternative policy is available in your location. For more about WFRP, see Further Resources listed at the end of this publication.
Insuring the Higher Value of Organic Pulses
Crop insurance coverage for both organic and non-organic pulses is limited to selected states and counties. For organic revenue policies for dry beans, policies are available in some counties of only three states: Michigan, Minnesota, and North Dakota. For organic dry bean yield coverage, policies are available in the additional states of Arizona, California, Colorado, Idaho, Kansas, Montana, Nebraska, New York, Oregon, South Dakota, Texas, Utah, Washington, Wisconsin, and Wyoming.
Organic revenue policies for dry peas are only available in Idaho, Montana, North Dakota, South Dakota, and Washington. For organic dry pea yield coverage, the policies are available in the additional states of Alaska, Colorado, Idaho, Kansas, Nebraska, Oregon, and Wyoming.
Outside of these states, crop insurance protection for organic pulse crops is only available through the Whole-Farm Revenue Protection policy, as noted above.
Example: Revenue Protection for Organic Black Beans in Minnesota
There are two types of revenue protection available in the eight states with this option for insuring dry beans and peas. Although the following example is for organic black dry beans, the same basic explanation would apply for various types of organic dry peas.
In 2020, the projected price for certified organic black beans in Minnesota was $26 per cwt. The estimated organic harvest price for black beans was $24 per cwt. These two price estimates provided by RMA were the same for non-organic black beans, but this is not always the case for the various types of dry peas and beans. If the organic farmer had an insurable cause of yield loss, or if the price of organic black beans fell below $26 per cwt, an indemnity (loss) payment would be made, up to the deductible level of 70% of the total loss. No crop insurance policies pay for 100% of the total loss; there is always a deductible of some percent of the total loss.
If the harvest price of black beans also had been higher than the pre-planting projected price provided by RMA of $26 per cwt, say $30 per cwt, then the $30 per cwt would have been the basis of evaluating losses.
However, if a certified organic dry bean farmer had a contract to sell his organic black beans for more than $26 dollars per cwt, then that contract price would serve as the basis of calculating an indemnity payment, up to a specified limit set by RMA of $78 per cwt. This exception for organic farmers is known as a contract price addendum and can be added to many organic crop insurance policies.
It is important to note that if an organic farmer could not have obtained a contract price for her organic black beans above the non-organic price, then the organic farmer would be underinsured relative to her non-organic neighbors. On the other hand, if the organic black bean farmer could obtain a contracted price higher than $78 per cwt, then the organic farmer would also be underinsured for the actual higher value of this black bean crop.
The second type of revenue protection offered for organic pulse growers is called Revenue Protection with Harvest Price Exclusion (RPHPE). The only difference is that RPHPE estimates the value of losses based only on the projected price and not the higher harvest price. The RPHPE is a less costly policy, but the possible risk of price changes during the growing season is not accounted for. In Minnesota, 51% of dry bean growers utilized one or the other of these revenue protection policies, but, unfortunately, separate data on organic dry bean farmers’ use of revenue and yield policies is not available.
Example: Yield Protection for Organic Great Northern Beans in Minnesota
Yield crop insurance protection only pays for losses that impact yield, as noted above. Estimating the value of the loss is based only on the projected price or, in the case of a contracted organic price, up to the limit imposed by RMA. In this example, we explore the case of organic Great Northern Bean yield protection in Minnesota.
In Minnesota in 2020, the projected price of organic Great Northern Beans was $60 per cwt. The maximum organic contract price allowed by RMA for organic Great Northern Beans was $90 per cwt. If yield loss occurred due to an insurable cause, then that indemnity payment would be estimated using these values. In both cases, the higher value of this type of organic dry bean is recognized, unlike the black bean case above. Thus, the advantage of having a contract price for organic dry beans is clear in this case. However, if the price of organic Great Northern Beans rose above $60 dollars per cwt or above $90 per cwt in the contract case, the value of the yield-loss indemnity would not reflect that market change during the season.
Crop Insurance Cost or Investment
It is worth repeating that crop insurance addresses only certain types of risks and, though highly subsidized, is nonetheless a real cost of production. However, crop insurance could also be viewed as an investment in securing the financial viability of the farm or ranch, particularly as we appear to be entering a period of extreme weather and climate disruption. Organic production systems may provide an improved degree of resiliency in the face of these external threats, but severe drought, floods, and winds can present circumstances from which even the best-designed systems cannot easily recover. Farm operating credit and private loans can also provide some ability to get past difficult weather and pest circumstances, but it is not clear that these institutions recognize that organic production systems may provide lower production and revenue risks.
Summary
Pulse production is now a significant part of the ever-evolving improvement of organic— and even non-organic—production systems in the United States. However, this has not always been the case. The use of pulse crops as a cover crop and/or as a green manure in organic field crop production systems has often been of greater importance than its production as a cash crop.
A case in point is the tale of organic lentils in Montana. In an engaging and thoroughly entertaining book, The Lentil Underground: Renegade Farmers and the Future of Food in America, author Liz Carlisle tells the almost 30-year story of how Montana organic farmers became the major organic lentil producers in the United States, if not the world.
Thirty years is a long time for the development of the organic lentil market, for what only now appears as a logical and needed sustainable diversification of cropping systems everywhere.
References
Bellows, B., M. Morrison, and C. Mitchell. 2020. Soil Health Indicators and Tests. ATTRA publication. National Center for Appropriate Technology, Butte, MT.
Buwani, D., M.R. Fernandez, P. Lokuruge, R. P. Zentner, and M. P. Schallengerg. 2021. Economic analysis of organic cropping systems under different tillage intensities and crop rotations. Renewable Agriculture and Food Systems. p. 1-8.
Carlisle, Liz. 2015. The Lentil Underground: Renegade Farmers and the Future of Food in America. Penguin Random House, New York, New York.
Gunstone, T., T. Cronelisse, K. Klein, A. Dubey, and N. Donley. 2021. Pesticides and soil invertebrates: a hazard assessment. Frontiers in Environmental Sciences. Vol. 9, Article 643847. P. 1-32
Hora, Mitchell. 2020. Interview on Fieldwork. May 6.
Jones, C., R. Engle, and K. Olson-Rutz. 2019. Soil acidification in the semiarid regions of North America’s Great Plains. Crops and Soils. Vol. 5, Issue 2. p. 28-56.
Kibiwott, Joseph, agronomist, Timeless Foods, Ulm, Montana. 2021. Private communication, August 13.
McVay, K., M. Burrows, F. Menalled, C. Jones, K. Wanner, and R. O’Neill. 2013. Montana Cool-Season Pulse Production Guide. Montana State University Extension. Publication EB0210.
Montana Organic Association. 2020. The Story of Vilicus Farms. Organic University Series.
Morris, M., E. Belasco, and J. Schahczenski. 2019. Is Organic Farming Risky? Improving Crop Insurance for Organic Farms. National Center for Appropriate Technology, Butte, MT.
North Dakota State University Extension. 2019. Pulse Crop Field Guide.
Smith, R. 2018. Automated weeders have arrived in vegetable fields. Growing Produce. July 11.
USDA Agricultural Marketing Service (AMS). 2021. Weekly, Bean, Pea and Lentil Market Review, July 27, 2021.
USDA National Agricultural Statistical Service (NASS). 2020. 2019 Organic Survey, Volume 3, Special Studies, Part 4.
USDA National Agricultural Statistics Service (NASS). 2017. Certified Organic Survey 2016 Summary.
USDA Risk Management Agency (RMA). 2021. Summary of Business.
Westerhold, Ashlee. 2019. 2019 Costs and Returns Estimate: Southcentral Idaho: Magic Valley. Commercial Dry Beans. EBB3-DB-19, University of Idaho Extension.
Further Resources
ATTRA’s Crop Insurance and Risk Management publications, webinars, podcasts and blogs (including information on Whole-Farm Revenue Protection)
Northern Pulse Growers Association
OGRAIN: The Organic Grain Resource and Information Network
Organic crop insurance information from the USDA Risk Management Agency
Organic Trade Association, Organic Grains Reports
Buyers of Organic Pulses
Complete listing of organic pulses buyers can be found at this link the on the USA Pulses website. You can filter by various organic pulse buyers/suppliers.
Organic Pulses Production, Economics, and Marketing
By Andrew Coggins, NCAT Rocky Mountain West Regional
Director, and Jeff Schahczenski, NCAT
Agricultural and Natural Resource Economist
Published January 2022
© NCAT
IP622
Version 011222
This publication is produced by the National Center for Appropriate Technology through the ATTRA Sustainable Agriculture program, under a cooperative agreement with USDA Rural Development. ATTRA.NCAT.ORG.