No-Till Case Study, Richter Farm: Cover Crop Cocktails in a Forage-Based System
By Susan Tallman, NCAT Agronomist
Abstract
A forage-based cropping system routinely removes most plant biomass from the land by baling hay or chopping silage. This results in inadequate plant residue for healthy soil biology function and soil protection. One solution, used by Marlyn and Patrick Richter in North Dakota, is to grow a multispecies cover crop cocktail after an early forage harvest to add needed residue, organic matter, and available soil nutrients for the subsequent cash crop.
Contents
Introduction
2007 Cover Crop Cocktail Following Early Forage Harvest
2008 Field Corn Crop
Further Benefits and Beyond
Reference
Introduction
Brothers Marlyn and Patrick Richter farm 2600 acres of cash grains and forages on their diversified dairy and beef cow operation in Menoken, North Dakota, near Bismark. Their farm includes a feedlot for custom background feeding of 450 beef cattle, a dairy operation of 120 Holstein cows, and a herd of 160 Black Angus cow/calf pairs for beef production. The Richters also raise their own dairy and beef replacement heifers. At any given time, the Richters may have 750 or more cattle on their farm.
The Richters use their cropland as the main source of feed for their cattle, with most of the cropland devoted to forage production, such as hay and silage. About half of their crops are used to feed their cattle, and the other half of their crops are sold for cash off the farm.
Most of their cropland is rain-fed, with an average of 15.4 inches of annual precipitation. They do have one pivot irrigation system on a 128-acre parcel of land.
The Richter farm has fragile sandy and sandy loam soils, many of which are classified as Highly Erodible Land (HEL). Their farm has a history of wind erosion, and in the 1950s and 1960s tree windbreaks were installed on the cropland to help minimize soil loss. However, even with this conservation method, they still had wind erosion occurring. When they started a no-till system in 2001, their primary goal was to reduce wind erosion.
They did see some improvements in their soil by switching to a no-till system. When they first started no-till, their soil organic matter levels were between 0.9% and 1.8%. Nine years later, their soil organic matter levels average between 1.8% and 2.6%.
Even after converting to no-till, however, the Richters found it difficult to maintain enough residue on the soil surface. Because so much of the crop biomass was taken off the field for silage or hay, there was not enough residue left on the soil to protect it and to feed the soil biology. Marlyn Richter refers to this problem as “The Stockman’s Challenge.” Most stockmen want to take the entire crop off the field to feed their livestock. The challenge is to have the patience and foresight to leave enough residue on the field to protect the soil. This residue will improve soil health and the overall health of the entire farm in the long run.
The lack of residue on the Richters’ fields presented some problems. First of all, without the armor of soil residue, their evapotranspiration (ET) rates and soil temperatures were too high. Soil temperatures taken by NRCS during past growing seasons routinely exceeded 100° F on bare soils. In contrast, similar soils with surface residue recorded readings below 85°F. Their hot soils were losing more water to evaporation than necessary.
The Richters also wanted more organic matter to hold nutrients in the soil during large rain events. Because their soils are sandy and have little organic matter, a heavy rain of two inches or more would cause the nitrate in the soil to leach deep into the soil profile. This caused their crops to turn yellow as the nitrate flushed out of the root zone.
The Richters planned to improve their soil organic matter levels by planting a diverse cover crop mixture that would provide a high-carbon residue. However, they were concerned that the cover crop would use too much soil moisture and thereby decrease the yield of any subsequent crop. The Richters’ soils are sandy, ranging from 3.7 to 6.1 inches of available water capacity in the top four feet of soil. This compares with nine inches of available water capacity in the neighboring loamy soils. The Richters hoped that improving organic matter levels would increase the water-holding capacity of their soil.
Table 1. Average Available Water at Field Capacity, Richter Farms
| Soil Depth (feet) | Available Water (inches)
Lihen Loamy Fine Sand |
Available Water (inches)
Parshall Fine Sandy Loam |
| 0 -1 | 1.2 | 1.9 |
| 1- 2 | 1.1 | 1.6 |
| 2- 3 | 0.7 | 1.4 |
| 3 – 4 | 0.7 | 1.2 |
| TOTAL | 3.7 | 6.1 |
2007 Cover Crop Cocktail Following Early Forage Harvest
In order to address several resource concerns, the Richters planted a diverse cover crop cocktail on 72 acres of cropland (Table 3). They planted this cover crop in early July of 2007 after a crop of oats and peas that had been chopped for silage in June.
Cover Crop Cocktails
Cover crop cocktails are multiple species of cover crop plants seeded together to provide cover crop benefits. The technique has been used in North Dakota since 2001 and typically incorporates six or more species in a single mix. Interest in cover crop cocktails began after several North Dakota farmers attended a no-till conference where the success of cover crop cocktails in no-till systems in Brazil was highlighted (Bollinger et al., 2006).
The Richters had several resource concerns:
- Crop Diversity – incorporating a variety of species to stimulate increased soil microbial activity.
- Soil Organic Matter – the cover crop provides a second set of roots in the soil, increasing the amount of organic material to be converted to soil organic matter.
- Nutrient Cycling – using deep-rooted species to capture deep nitrogen and release near the soil surface for shallower-rooted crops.
- Surface Residue – provide additional residue for erosion and temperature control.
- Residue Management – utilizing livestock to harvest half the cover crop, leaving the other half on the soil surface for the soil biology; managing residue in a manner which allows it to be returned to the soil surface.
Table 2. 2007 Cover Crop Cocktail Mixture
| Species | Rate/acre (pounds) |
Season type | Plant type |
| Millet | 8 | Warm | Grass |
| Cowpea | 10 | Warm | Broadleaf |
| Soybean | 15 | Cool | Broadleaf |
| Turnip | ½ | Cool | Broadleaf |
| Oilseed radish | 1 | Cool | Broadleaf |
| Sunflower | 1 | Warm | Broadleaf |
| Sweet clover | 1 | Warm | Broadleaf |
In order to evaluate the performance of the cover crop, the Richters designed a test to compare it with two other treatments. Their goal was to evaluate the feasibility of producing a cover crop as well as to evaluate the performance of the subsequent grain crop in 2008. The brothers conducted these three field tests on a 120-acre parcel that had all been harvested for pea and oat silage in June of 2007.
Field 1 was 72 total acres and contained the cover crop cocktail with no manure added. Field 2 was 16 acres and had no cover crop, but did have an addition of 10 tons of manure per acre in the late summer of 2007 (July 15 to August 15). Field 3 was 32 acres and had no cover crop and no manure addition. All fields were adjacent to each other, with windbreaks running from east to west throughout the parcel.
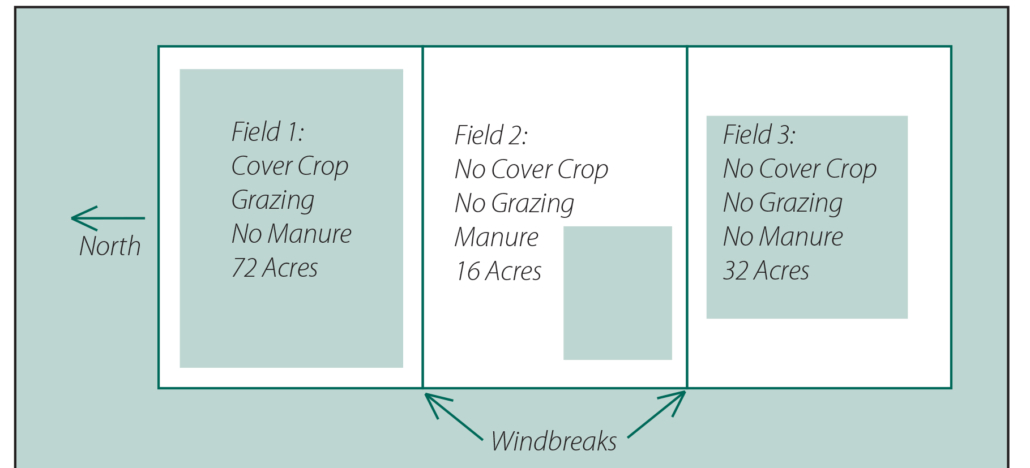
Figure 1. Cover Crop Field Trial Layout, Richter Farms, 2007
Field Treatments and Observations
Prior to seeding, all three fields were sprayed with glyphosate for weed control. Marlyn seeded Field 1 with the cover crop cocktail on July 7, 2007.
By August 2, Field 1 had a good canopy cover and stood about two feet tall. In September, Fields 2 and 3 received another application of glyphosate for weed control. However, Field 1 received no additional herbicide because the cover crop provided enough weed suppression.
By October 1, Field 1 was just over waist high and ready to graze. Most of the cover crop growth was still green, with little frost damage.
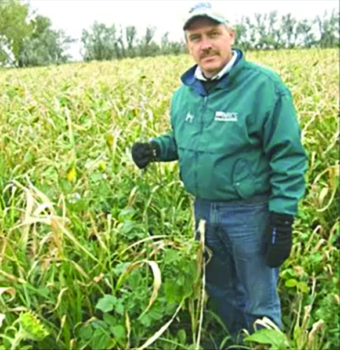
Jay Fuhrer of NRCS with cover crop cocktail ready for
grazing, on October 1, 2007. Photo: Joshua Dukart, BCSC
Cover crops can be terminated in various ways, including mechanical harvesting, rolling, spraying with herbicide, winter-kill, or grazing. The Richters decided to graze the cover crop to get the added benefit of an additional forage source for their beef cows and calves. The trampling of cattle hooves also provides an extra benefit in improving nutrient cycling by bringing more of the biomass in contact with the soil surface for breakdown by the soil microbes. Grazing also creates various levels of plant structure for erosion protection, with some of the plant material left standing and some trampled on the surface.
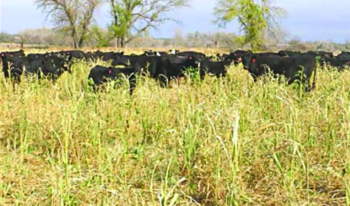
Cattle grazing the cover crop cocktail in October 2007. Photo: Joshua Dukart, BCSCD
Because the main purpose of the cover crop was to add residue, they only wanted to take half of the cover crop for grazing. The other half would be left for soil armor and as a means of stimulating the soil biology. Leaving half of the cover crop residue was the Richters’ way of solving The Stockman’s Challenge.
Grazing the Cover Crop
The Richters turned 141 cow-calf pairs onto Field 1 on October 1. Prior to grazing, they weighed each calf. The calf starting-weight average prior to grazing the cover crop was 580 pounds.
The cattle grazed for 17 days and left Field 1 on October 17. After this grazing period, the calves were weighed again. The average ending weight was 632 pounds, which translates to an average weight gain of 52 pounds per calf, or 3.1 pounds per calf per day, a very good rate of gain, especially when compared with native grazing land at that time of the year.
As Marlyn and Patrick noted the grazing preferences of the cattle in the cover crop, they made several observations. The cattle had definite preferences and grazed the cover crop in the following order:
- Millet heads
- Millet leaves
- Soybean, cowpea, sunflower
- Brassica leaves (turnip and radish)
- Brassica roots
While the cows were grazing the cover crop, a fecal sample was taken to find out whether the dietary needs of the livestock were being met (Table 3).
Table 3. Fecal Sample Analysis, Field 1, October 5, 2007
| Material | Amount |
| Crude Protein | 15.01% |
| Digestible Organic Matter | 65.95% |
| Fecal Nitrogen | 2.38% |
| Fecal Phosphorus | 0.60% |
Samples tested by Grazingland Animal Nutrition Lab, Texas A & M University
The ratio of digestible organic matter to crude protein is used as a measure of rumen efficiency in cattle. An acceptable range for this ratio is between 4:1 and 7:1, with 4:1 being ideal. This ratio for the Richter cattle was 4.39:1 , indicating that the cover crop was not too lush, nor was it too dry for cattle consumption.
Not only did the direct grazing benefit the soil, it also helped the bottom line. There was no cost to harvest and store the forage. Nor was there the added cost of moving the manure from the feeding area and applying it to the fields. Direct grazing saved the Richters time and money, which is an added benefit of the cover crop.
Cover Crop Budget Analysis
The Richters calculated the gross income from grazing the cover crop at $111 per acre, as shown in Figure 2.
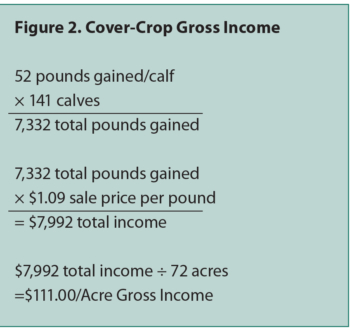
Figure 2. Cover Crop Gross Income
The total expense for the cover crop was $45 per acre. This consisted of the seed cost of $20 per acre, the cost of seeding at $13 per acre, and the cost of one glyphosate application prior to seeding at $12 per acre.
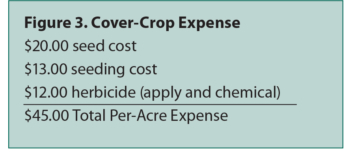
Figure 3. Cover Crop Expense
Together, this income and expense result in a $66 per-acre net income.
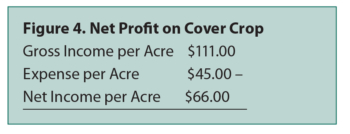
Figure 4. Net Profit on Cover Crop
While the Richters gained about $66 in measurable returns, they also gained some intangible benefits, including the recovery time for their native grazing land. While the cattle grazed the cover crop, the land usually grazed at this time had an opportunity for regrowth.
In Marlyn and Patrick’s opinion, the cover crop was worthwhile for the grazing benefit alone. But the story doesn’t stop there. The benefits of the cover crop carried forward to the 2008 field corn crop. Let’s look at the next chapter in this story.
2008 Field Corn Crop
In the spring of 2008, after the cover crop year, the Richters made some observations of the three crop fields in their test. First of all, there was no noticeable wind erosion in Field 1. In contrast, Fields 2 and 3 did have some observable wind erosion, particularly on the sandier knobs farther away from the windbreaks. Also, there was little weed pressure in Field 1 and significant weed pressure in Fields 2 and 3.
Weed pressure in spring 2008. Photo: Jay Fuhrer, NRCS
Next, they observed about three times the earthworm population in Field 1 compared with Fields 2 and 3.
In addition to these visual observations, they also measured the available water and water capacity in each field. They were concerned that the cover crop might have used too much soil moisture and that Field 1 would have decreased corn yields as a result.
However, analysis of each field showed no significant difference in available water capacity between the field with the cover crop and the fields without cover crops.
Table 4. Estimated Inches of Available Water
(Sampled on May 6, 2008. Richter Farms. Soil Type: Parshall Fine Sandy Loam. Testing by USDA-ARS Lab, Mandan, North Dakota)
| Depth
(inches) |
Field 1
Cover Crop (Inches of Available Water) |
Field 2
No Cover Crop (Inches of Available Water) |
Available Water (inches) at Field Capacity |
| 0 – 6 | 0.4 | 0.4 | 1.0 |
| 6 – 12 | 0.6 | 0.5 | 0.9 |
| 12 – 24 | 0.8 | 0.9 | 1.6 |
| 24 – 36 | 0.7 | 0.7 | 1.4 |
| 36 – 48 | 0.5 | 0.6 | 1.2 |
| Total ( 0 – 48) | 3.0 | 3.1 | 6.1 |
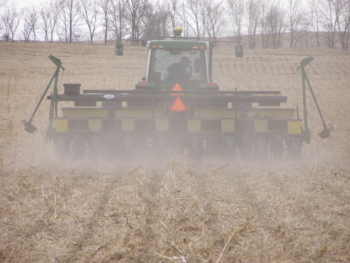
Seeding corn on May 6, 2008. Photo: Jay Fuhrer, NRCS
On May 5, the Richters planted Pioneer 39D80 corn in all three fields at a rate of 19,000 plants per acre.
Throughout the growing season, they received almost 15 inches of rain in the intervals shown in Table 6. The year 2008 started out as one of the driest in Burleigh County history, but by December it was close to an average year, with the same amount of rainfall in the growing months as they normally receive during the entire year.
Table 5. 2008 Precipitation, Bismarck Municipal Airport, North Dakota
| Month | Precipitation
(inches) |
Departure from Normal (inches) |
| January | 0.11 | -0.34 |
| February | 0.41 | -0.1 |
| March | 0.45 | -0.4 |
| April | 0.73 | -0.73 |
| May | 1.27 | -0.95 |
| June | 3.92 | 1.33 |
| July | 2.84 | 0.26 |
| August | 1.13 | -1.02 |
| September | 2.46 | 0.85 |
| October | 1.73 | 0.45 |
| November | 2.25 | 1.55 |
| December | 1.41 | 0.97 |
| Total | 18.71 | 1.87 |
Source: NOAA, 2008 Annual Climatological Summary, Station 320819
All three fields received the same fertility treatment during 2008. Commercial fertilizer (21-24-12) was applied to all three fields at a bulk rate of 200 pounds per acre. (Recall that manure had been applied to Field 2 in 2007, but not to Fields 1 and 3.)
The Richters applied glyphosate to all three fields for weed control right after corn planting in May. All three fields were sprayed again in June. However, in July, Field 1 did not receive another glyphosate application, while Fields 2 and 3 did. Why? Field 1 had enough cover crop residue left to suppress weed growth until the corn developed a canopy in late June. Fields 2 and 3 did not have this residue, and required the additional herbicide application.
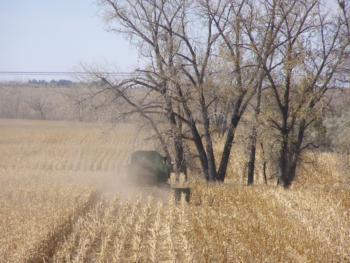
The corn was harvested for grain on October 31, 2008, and a weigh wagon was on hand to help record yield and moisture data from each field. The Richters deliberately decided to harvest this crop for grain instead of silage, in order to leave more residue on the field.
Table 6. 2008 Corn Harvest Yield Data
| Field | 2007 Treatment | Weight
per bushel |
Moisture | Yield
per acre |
| 1 | CC, no manure | 56.5 | 14.9 | 82.8 |
| 2 | No CC, manure | 55.5 | 13.9 | 87.3 |
| 3 | No CC, no manure | 55.5 | 14.1 | 73.5 |
Corn Crop Budget Analysis
While Field 2 had the greatest yield, the budget analysis shows that Field 1 was actually more profitable. The gross income for each field is presented in Table 8.
Table 7. 2008 Corn Harvest Gross Income per Acre
| Field | Treatment | Yield
Per acre |
Cash Price | Gross Income
Per acre |
| 1 | CC, no manure | 82.8 | $3.50 | $289.80 |
| 2 | No CC, manure | 87.3 | $3.50 | $305.55 |
| 3 | No CC, no manure | 73.5 | $3.50 | $257.25 |
Most of the expenses were the same for all fields. However, less herbicide and no manure were applied to Field 1, which significantly reduced the cost of production.
Table 8. 2008 Corn Expense Summary per Acre (in dollars)
| Field 1 | Field 2 | Field 3 | |
| Fertilizer | 51.30 | 51.30 | 51.30 |
| Seed | 33.33 | 33.33 | 33.33 |
| Seeding | 16.00 | 16.00 | 16.00 |
| Manure | 0 | 12.50 | 0 |
| Herbicide | 31.90 | 47.85 | 47.85 |
| Harvest | 25.00 | 25.00 | 25.00 |
| Land Exp. | 35.00 | 35.00 | 35.00 |
| Crop Ins. | 35.00 | 35.00 | 35.00 |
| Total Expenses | $227.53 | $255.98 | $243.48 |
When the expenses are combined with the gross income, the net income results:
Table 9. 2008 Corn Net Income per Acre
| Field 1 | Field 2 | Field 3 | |
| Total Expenses | 227.53 | 255.98 | 243.48 |
| Gross Income | 289.80 | 305.55 | 257.25 |
| Net Income | $62.27 | $49.57 | $13.77 |
Even though Field 2 had the greatest yield, with 87.3 bushels per acre, it only returned $49.57 per acre to the bottom line. In contrast, Field 1 had the best income return with $62.27 per acre, even though it yielded less, at 82.8 bushels per acre. Field 3 couldn’t compete with the other two and brought only $13.77 per acre to the bottom line. Field 3 had the double threat of low yield and high input cost.
Not only did the cover crop bring income to the bottom line in 2007 through grazing, it also helped the bottom line in the 2008 corn crop. This was a positive double benefit in addition to the improved soil health.
Further Benefits and Beyond
After the corn harvest in 2008, the Richters decided to graze the cornstalk residue on all three fields. They turned out 153 cows for 20 days, which saved them about $2,760 in direct feed costs.
Both Marlyn and Patrick say that the value the cover crop has brought to the health of their soil is priceless. They see a benefit to the bottom line, but the most important benefit is the improvement in their soil health. They hope to continue using a cover crop on each field every three to four years, following a June-harvested forage crop. When using a cover crop, they plan to leave at least half of the residue for the soil health benefits. They find that if a stockman is patient and willing to put soil health as a top priority, the rewards will come back to him in multiple ways.
The Stockman’s Challenge is to improve soil quality while concurrently using the soil to provide livestock feed. The Richter brothers showed that using a multispecies cover crop cocktail resulted in healthier soil and a healthier farm.
Reference
Bollinger, Adrian, Jakob Magid, Jorge Carneiro Telmo Amado, Francisco Skóra Neto, Maria de Fatima dos Santos Ribeiro, Ademir Calegari, Ricardo Ralisch, and Andreas de Neergaard. 2006. Taking stock of the Brazilian “Zero-Till Revolution”: A review of landmark research and farmers’ practice. Advances in Agronomy. Vol. 91. p. 47-64.
No-Till Case Study, Richter Farm: Cover Crop Cocktails in a Forage-Based System
By Susan Tallman,
NCAT Agronomist
Published October 2012
© NCAT
IP437
Slot 438
This publication is produced by the National Center for Appropriate Technology through the ATTRA Sustainable Agriculture program, under a cooperative agreement with USDA Rural Development. ATTRA.NCAT.ORG.