
15 Years of Change – A Brief Overview of Changes to Montana’s Small Grain Cropping Systems 2007-2022
 Print This Post
By Andrew Coggins, NCAT Rocky Mountain West Regional Director
Changes are happening in Montana agriculture. The past 15 years have seen significant change in acreages in field crop production, acreages lost each year to failed or abandoned crops, acreages committed to cover cropping and soil improvement, acreages registered as organic, and acreages fallowed.
All of this tells a story, or stories, particularly in a state that still has substantial production acreage locked into wheat-fallow-wheat type monoculture, and where cover cropping has been slow to take hold in many areas, typically due to summer drought conditions and low precipitation.
But, travelling to various conferences across Montana and in North Dakota over the past few years, and talking to many farmers and company representatives, there are some additional changes taking place, many of which are occurring within the monoculture systems along the high line and in the Golden Triangle of Montana.
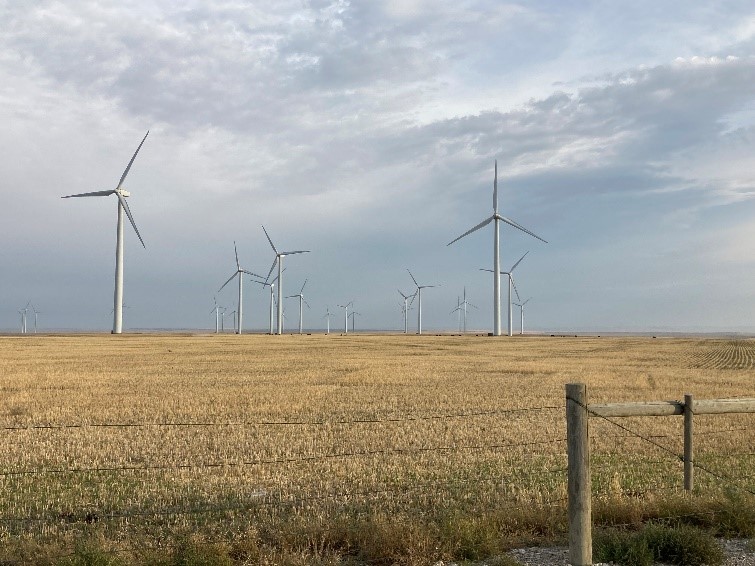
According to the 2017 Census of Agriculture (Montana), there were 58,122,878 acres of agricultural land within a state total of around 94,105,600 acres. Just under 62% of the total is in agriculture production. The 2007 Census recorded 61,388,462 acres of agricultural land, therefore a loss of 3,265,584 acres in 10 years. In a state the size of Montana, this can look and feel insignificant, but this is a substantial amount. We are all aware of the urban expansion of some cities in southwestern Montana, but probably less aware of acres being used for other developments, such as wind farms. I use this example only because information on wind farms is quite detailed in contrast to estimating land loss from urban expansion and homesteading.
Wind farms across Montana have increased from 144.7 megawatts in 2005 to 1117.1 megawatts in 2020 (source). At an average estimate of 60 acres of land per megawatt produced, this amounted to 67,026 acres by 2020. Very soon this will be in the region of 174,000 acres – a 260% increase in three years. Some might also be retained as grazing land, of course, but the speed of these developments should not be underestimated.
According to the U.S. Energy Information Administration, “In early 2023, the state had nearly 1,500 megawatts of wind power generating capacity in operation. Another 1,400 megawatts of wind capacity and related battery energy storage were in various stages of planning and construction.”
The cropping systems
To address this overview of changes in cropping systems, I have chosen the time period of 2007 to 2022, partly because it encompasses four U.S. Censuses of Agriculture (2007, 2012, 2017, and 2022), though 2022 is not yet available. Unfortunately, certain information, such as ‘cover cropping, or soil improvement’ acreage and ‘cropland in summer fallow’ acreage, is only recorded in the census every five years and not in the yearly Montana Agricultural Statistics. Both these metrics would be very useful on a yearly basis as ‘summer fallow’ is a very good indicator of the wheat –fallow-wheat systems which still dominate agriculture land use in Montana.
However, crop acreages and crop losses can be monitored on a yearly basis though the Montana Annual Bulletins, as well as through the U.S. Census of Agriculture every five years.
A summary of the principal crops
Though these crop rankings vary (often yearly), Montana is currently the largest producer of lentils and chickpeas, and ranked second for barley, dry edible peas, canola, flaxseed, safflower, and durum wheat (Montana Agricultural Statistics 2022). One thing to keep in mind with these statistics is that specific crops can disappear from the lists and then reappear later. Examples in Montana include camelina (2017), pinto and other dry beans (2019), Austrian winter peas (2019), mustard seed (2018), and seed potatoes (2018).
This loss of data could be due to state and federal funding cuts to NASS and other organizations that fund (or not) work on specific surveys for commodities not included in the federal program. Some of these crops will have been reassessed for inclusion in the next census year (2022), while others will remain ‘off the system’ until there are sufficient acres grown again to justify recording. An example is camelina, which has steadily dropped from 22,500 acres in 2007 to 700 acres in 2016 before being removed from the statistics. There is renewed interest in this oilseed in Montana due to its drought tolerance over safflower or canola, but there will need to be a significant increase in the acreage grown to make it back onto the list of recorded data.
Potatoes and sugar beet. Both seed potato and sugar beet production are very regionally specific and specialized within Montana, with a lot of equipment and infrastructure tied up in production, harvesting, and storage. Not surprisingly, therefore, acreages of both crops have remained fairly constant from 2007 to 2021, with planted potato acreages running between 10,000 and 12,000 acres throughout the period, and sugar beet from 41,800 to 47,500 acres (with the exception of 2008 and 2009) (The Potato Association of America).
Winter wheat, spring wheat, durum wheat, spring barley. Given the dominance of these grains, none are likely to disappear from the statistics anytime soon. Planted/harvested acres for barley is 970,000 acres/650,000 acres, 5,520,000 acres/4,530,000 acres for winter wheat, (2,900,000 acres/2,180,000 acres) for spring wheat, and 670,000 acres/620,000 acres for durum wheat (Montana Agricultural Statistics 2022). The acreages of these crops are very interrelated and are good indicators of seasonal weather patterns. For instance, a dry fall can mean a high percentage of sown winter wheat failing, which in turn can lead to higher-than-normal spring wheat, barley, or durum wheat acreages being sown.
Safflower, flax, and canola. These are the three principal oilseed crops in Montana (even before the demise of camelina), with safflower having peaks and troughs between 27,000 acres and 53,000 acres planted over 15 years. By contrast, flax and canola have both seen large and consistent increases in acreage from 9,000 acres of flax in 2008 to 135,000 acres in 2021, and 6,500 acres of canola in 2009 to 185,000 acres in 2021. This could be due to several factors, including recent large-scale statewide trials in Montana of canola, by Cargill, while flax is often the go-to oilseed crop (alongside canola) for inclusion in pulse-grain-oilseed-grain rotations in more arid areas due to its greater drought tolerance.
Dry edible beans, chickpeas, and lentils. Montana has a long legacy of lentil production particularly within the organic sector. Planted acreage has steadily risen from 87,000 acres (2007) to 530,000 acres in 2021, an amazing increase. Chickpeas currently stand at around 175,000 acres sown (2021). Lentils and chickpeas (garbanzo beans) appear to be the legume-pulse choices for simple crop rotations (as described above) within the Golden Triangle and the high line areas of central Montana. The other dry edible beans (such as pinto and fava beans) have very small sown acreages (just 3,000 acres of pinto beans sown in 2018, for instance) at this time.
Dry edible peas and Austrian winter peas. This last major set of Montana crops are also legume/pulse crops. The principal reason for separating these two classes out is that dry peas – yellow and green – tend to be the pulse component of crop rotations more in the central/eastern side of Montana and the western side of North Dakota, possibly related to slightly higher annual precipitation. From 235,000 planted acres in 2007, dry edible peas have seen a steady rise to 570,000 acres sown in 2021. While Austrian peas still recorded 12,000 acres sown in 2018, data was discontinued after this point, possibly because Austrian winter peas are widely used within cover crops not as cash crops, as is mustard (data discontinued in 2018). For the same reason, there is little data on cereal rye production in Montana.
Conclusion
Like any data, it is possible to find slightly different figures for any given crop in any given year from different sources, but they should all follow the same trend. So, for example, sown acres of flax, sugar beet, chickpeas, and canola really dipped in 2009, and I would expect data from other sources would show similar patterns.
This blog is intended only as a brief overview. A much more detailed review would need to account for many more factors barely mentioned here, such as seasonal and yearly weather patterns, market economics and crop prices, input costs such as seed, fertilizer, and chemical costs, crop trends at county level, how organic production systems relate to crop losses overall in each given year, crop insurance costs, and much more.
Related ATTRA Resources:
Organic Pulses Production, Economics, and Marketing
Episode 226. Organic Pulse Production Is Timeless in Montana
Livestock and Crops: Korey Fauque’s Montana Dryland Farm. Part 2
Organic Small Grain Production Overview
This publication is produced by the National Center for Appropriate Technology through the ATTRA Sustainable Agriculture program, under a cooperative agreement with USDA Rural Development. ATTRA.NCAT.ORG.
 USDA NRCS photo by Carly Whitmore


 USDA Photo by Lance Cheung.