
A Tale of Two Pastures: Pasture Response to Catastrophic Events
 Print This Post
By Justin Morris and Linda Poole, NCAT Regenerative Grazing Specialists
Did you know that pasture health and flying in an airplane are similar in some ways? If not, don’t worry; you’re not alone. A catastrophic event that happens in flight can resemble how a pasture responds following a catastrophe. Let us explain…
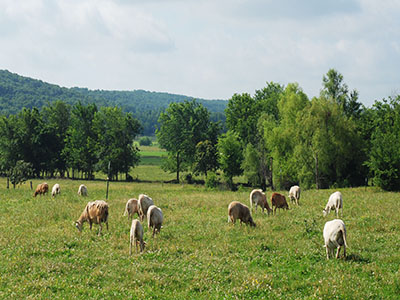
Catastrophic events in a pasture scenario can take the form of a prolonged drought, wildfire, flood, or even grasshoppers. But not all pastures respond the same way when a catastrophe strikes.
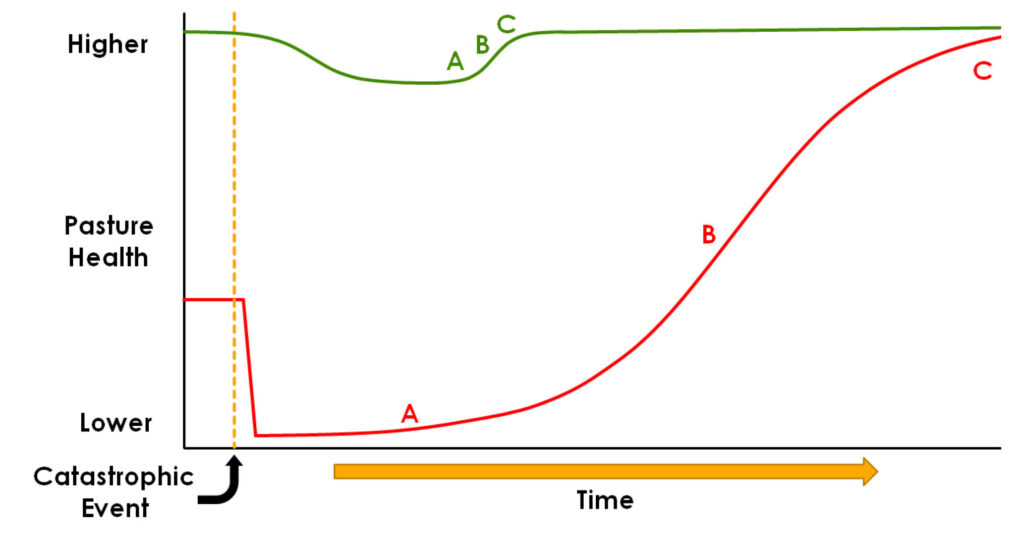 The graph above represents our understanding of how pastures generally respond after a major disturbance or catastrophe. The horizontal axis represents time, with the arrow pointing to the right showing time progressing forward. Because each field represents a unique combination of soil types, soil life, vegetation, microclimate, and management, the time it takes to achieve a high level of pasture health cannot be predicted exactly. This is why there’s no definite time value at the far right.
The vertical axis represents the level of health for a pasture, ranging from a lower level of health at the bottom to a higher level of health at the top.
The green curve represents a pasture that’s in a higher state of health where plants are not grazed until fully recovered from grazing, with minimal to no bare soil and a crumbly soil texture. The red curve represents a pasture that’s in a lower state of health where plants are continuously overgrazed with lots of bare soil and high levels of compaction.
Now look at where letters A and C are positioned on each of these two lines. The further it is between points A and C, the slower the rate of improvement of the pasture after the catastrophe. And the shorter and steeper the line is between points A and C, the faster the pasture bounces back to health.
Looking at the red line, you can see that when a catastrophic event occurs in pastures that are low in health to start with, the health of the pasture begins to decline almost immediately, and it falls very abruptly – like falling off a cliff. And not only does pasture health decline quickly and abruptly, but it declines much further compared to the healthier pasture. As the pasture begins to recover, (red letter A), the rate or speed of improvement is very slow and may not even be noticeable for quite some time. Given enough time and rest (red letter B), pasture health begins to improve more rapidly as it exceeds its pre-catastrophic state. And if grazing management continues to be proactive, a much higher state of health that far surpasses the pre-catastrophic state can eventually be achieved.
On the other end of the spectrum, healthier pastures (shown by the green line) maintain their state of health for a while after the catastrophe. Eventually, the healthier pasture decreases in health somewhat, but the decline is gradual and doesn’t drop very far. Because of the initial high state of health before the catastrophe, along with continued proactive grazing management that is constantly monitoring for full plant recovery, the recovery period (shown with green letters A, B and C) is very short.
The difference in the time it takes for these two pastures to recover following a catastrophic event illustrates the concept of resiliency—being able to withstand or recover quickly from difficult conditions. Pastures in a high state of health are very resilient, as they do not decrease in health very much after a catastrophe and recover very quickly. Pastures in a low state of health are not very resilient since they decrease in health suddenly and significantly while taking a long time to recover.
Consider for a moment how this all translates into potential profit or loss, as well as stress on the grazier. When a catastrophe happens and pasture health drops suddenly, the grazier has a grass emergency with little time to minimize the severity of the catastrophe. There’s little time to come up with another plan to care for both the land and the livestock. Responding quickly is necessary but can be very costly.
One option is to destock some or all of the herd. But it can be tempting to retain most of your stock in hopes that the effects of the catastrophe will suddenly end. But if the catastrophe is a drought, no one knows when it will end. Graziers who choose to stay the course by keeping their livestock moving through their regular rotation will find that pastures get progressively shorter and shorter until there’s nothing left. At this point, livestock must be put on a full ration of hay to prevent losing condition and performance. Or they must be sold or moved elsewhere until the pastures recover. All three of these options can be very expensive. Hay during droughts is often hard to purchase and very expensive. If livestock are sold, the price received for the animals will likely be very low. The third option of moving livestock to a completely different location may not even be possible but if it is, it could come at a prohibitively high cost.
Finally, let’s look at how long it takes for the less-healthy pasture to return to its pre-catastrophic state: starting in low health then being hit by catastrophe, the pasture spends a lot of time in a very slow rate of recovery, requiring a lot of expensive inputs in the meantime.
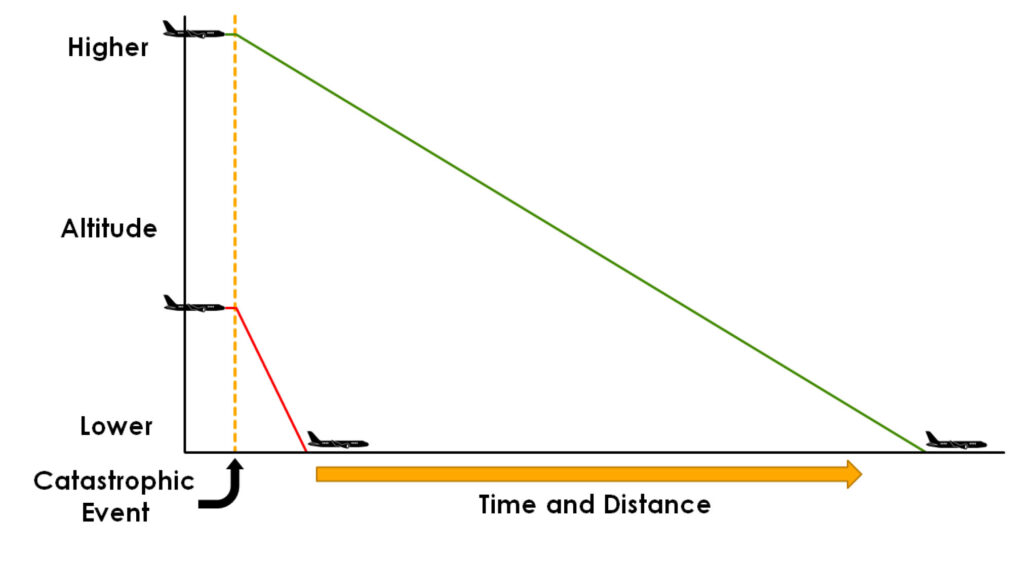
The difference between these two pasture scenarios is a lot like flying in an airplane. A pasture in a low state of health is like a plane flying at a very low altitude, such as right after takeoff or when getting ready to land. If something happens that forces the plane to make an immediate landing and the plane is only 1,000 feet above the ground, the pilot has only a matter of seconds to find somewhere to land that’s within a very short distance. The red line angling downward in front of the plane at the lower altitude shows a trajectory that is not very far and quite steep because planes at such low altitudes are generally flying much slower than they are at cruising altitude. This is like that sudden drop we see with the red line from the previous graph just after a catastrophe.
On the other hand, a healthy pasture is like a plane flying at an altitude of 35,000 feet and 640 miles per hour. If for some reason the plane must land as soon as possible, the pilot has a lot more time to make decisions while also having a lot more potential landing spots to choose from. The plane in this scenario is flying high and fast resulting in a gliding trajectory that is not as steep and covers a much longer distance. This is like that delayed and more gradual drop we see with the green line following a catastrophe.
In short, healthy pastures are much more resilient to catastrophes by providing more options and more time to manage adaptively compared to less-healthy pastures. So how do we get more time and decision space to deal with unavoidable pasture disaster? We follow the soil health principles!
For more information on this topic, see the January 2022 Food Animal Concerns Trust (FACT) webinar that we participated in.
Related ATTRA Resources:
Livestock and Pasture Management
Pasture, Rangeland, and Adaptive Grazing
Why Intensive Grazing on Irrigated Pastures?
The Impact of Grazing Frequency and Recovery Period on Plant Diversity and Soil Health
This publication is produced by the National Center for Appropriate Technology through the ATTRA Sustainable Agriculture program, under a cooperative agreement with USDA Rural Development. ATTRA.NCAT.ORG.


 NCAT
NCAT


