
Measuring and Conserving Irrigation Water
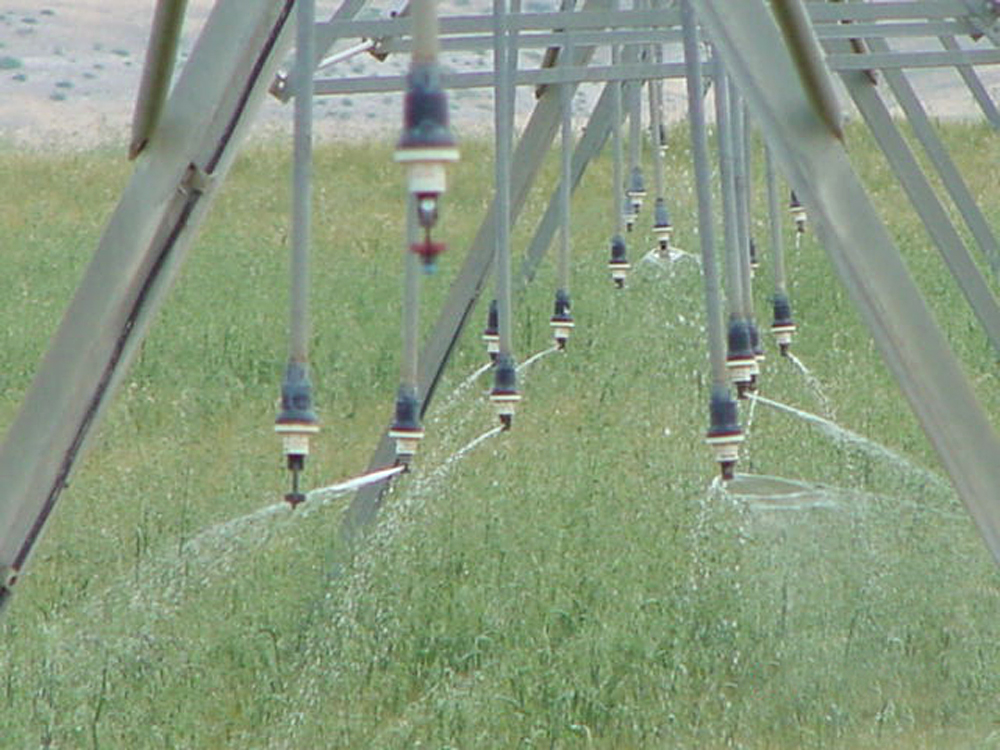
Photo: NCAT
By Mike Morris and Vicki Lynne, NCAT Energy Specialists
This publication describes how to find the net water application rate for any irrigation system. It further explains how to calculate the number of hours the system should be operated, describes several ways to measure flowing water in an open channel or pipeline, and offers suggestions for irrigating with limited water supplies.
Contents
Introduction
Finding Net Water Application in Inches per Set
Measuring Flows
Further Resources
Appendix: Finding Flow Rate with a Bucket Test
Introduction
This publication explains several ways to measure flowing irrigation water. Legions of irrigators make crop watering decisions by guesswork, imitation of the neighbors, or “the way it’s always been done.” If this sounds familiar, this publication is for you.
A basic understanding of your system’s capacity to deliver water is a very powerful piece of knowledge, one that allows you to take a more scientific approach to the irrigation process, achieve greater control, and begin conserving water without compromising crop yields. First and foremost, all irrigators need to know their system’s net water application rate, measured in inches per hour or inches per irrigation.
Not covered in this publication are some equally basic skills essential to irrigation management. All irrigators should know general irrigation guidelines for the crops they grow. All irrigators should know how to check soil moisture levels. Most irrigators should also track crop water use (evapotranspiration) as the season goes by. Your local Natural Resources Conservation Service (NRCS), Extension, or soil and water conservation district office should be able to assist you.
Finding Net Water Application in Inches per Set
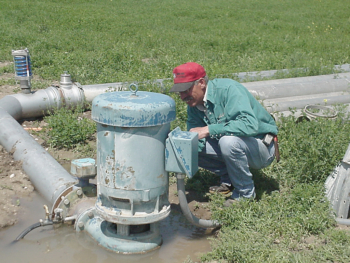
Photo: NCAT
Some sprinkler systems, and most surface irrigation systems, apply water in one location for a period of time before being turned off or moved to another area of the field. This period is often called a set or set time. Other sprinkler systems, such as center pivots and linear-move systems, move more or less continuously. Their set time is considered to be the period needed to cover the entire irrigated area.
Good irrigation management requires that you know how much water the irrigation system delivers to a crop’s roots over a given period of time. You can then adjust the
duration or frequency of your sets so the amount of water you put into the soil equals the amount that plants have used up.
Finding System Efficiency
In any irrigation system, some water is lost or fails (for a variety of reasons) to become available to the plant roots. For example, water is lost to deep percolation, wind drift, runoff, and evaporation during application. The term net water application refers to the amount of water (in inches of depth) that your irrigation system actually delivers to the crop root zone during a set. To calculate net water application, you start with the gross amount of water applied and multiply it by a system efficiency.
Table 1 shows attainable system efficiencies for some irrigation systems: the percentage of water that actually enters and remains in the root zone.
| Table 1. Attainable Irrigation System Application Efficiencies | |
| System Type | Efficiency (%) |
| Surface Systems | |
| Level border | 60-80 |
| Furrow | 60-80 |
| Surge | 65-80 |
| Graded border | 55-75 |
| Corrugate | 40-55 |
| Wild flood | 25-40 |
| Sprinkler Systems | |
| Linear move | 75-90 |
| Center pivot (low pressure) | 75-90 |
| Fixed solid set | 70-85 |
| Hand move or side roll laterals | 70-85 |
| Traveling gun | 65-80 |
| Stationary gun | 60-75 |
| Micro-irrigation systems | |
| Surface/subsurface drip | 85-95 |
| Micro spray or mist | 85-90 |
These are only average values for well-managed and well-maintained systems. Soil texture will heavily influence how your system’s efficiency compares to the ranges below. In situations where true application efficiency is hard to estimate, measured distribution uniformity (DU) may be the most accurate “system efficiency” value to use in the formulas and calculations below. DU measures how uniformly water infiltrates into the soil in various parts of a field. Talk to your local NRCS office or soil and water conservation district for help measuring your DU.
A Shortcut Method for Most Sprinkler Systems
To estimate net water application in inches per set for most sprinkler systems (but not pivots), you can simply use the following two tables. Use Table 2 to convert nozzle size and pressure to gallons per minute (gpm). Once you’ve determined the flow rate in gpm, use Table 3 (along with the correct spacing for your system) to fi nd your system’s gross water application in inches per hour. Then multiply this number by your system efficiency and set duration to find net water application.
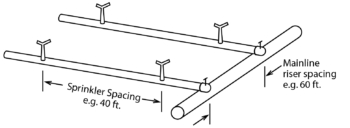
Figure 1. Spacing on hand-move sprinklers
For example, consider a side roll system with new 9/64-inch nozzles and 40 pounds per square inch (psi) operating pressure, with 40-foot by 40-foot sprinkler spacing (see Figure 1), and an 11-hour set time operating at 65 percent system efficiency.
From Table 2, find the 9/64-inch nozzle on the left and read across to the figure under 40 psi. The number is 3.7 gpm.
Then, using Table 3, find the 40-foot by 40-foot spacing on the left and read across to the 3 gpm and 4 gpm columns. Since 3.7 gpm is a little more than halfway between, estimate the gross water application at 0.22 inches per hour. Multiply 0.22 by 11 hours—the set duration—and by 0.65—the system efficiency percentage.
Net water application: 0.22 × 11 × 0.65 = 1.6 inches per set.
You can estimate net water application in inches per set for any irrigation system if you know the system’s flow rate, irrigated area, and system efficiency. The calculation is described in the following pages.
| Nozzle Size (inch) | Nozzle | Pressure | psi | ||
| 30 | 40 | 50 | 60 | 70 | |
| 3/32 | 1.4 | 1.7 | 1.9 | 2.0 | 2.1 |
| 1/8 | 2.6 | 3.0 | 3.3 | 3.5 | 3.8 |
| 9/64 | 3.3 | 3.7 | 4.2 | 4.5 | 4.9 |
| 5/32 | 3.9 | 4.5 | 5.0 | 5.4 | 5.8 |
| 11/64 | 4.7 | 5.4 | 6.0 | 6.6 | 7.1 |
| 3/16 | 5.5 | 6.3 | 7.0 | 7.7 | 8.3 |
| 13/64 | 6.4 | 7.4 | 8.2 | 9.0 | 9.7 |
| 7/32 | 7.4 | 8.6 | 9.6 | 10.5 | 11.3 |
Caution: The values in Table 2 are based on new nozzles. Flow from worn nozzles can vary significantly from these values.
| Sprinkler Spacing | |||||||||||||||
| 2 | 3 | 4 | 5 | 6 | 7 | 8 | 9 | 10 | 11 | 12 | 15 | 18 | 20 | 25 | |
| 30 x 30 | 0.21 | 0.32 | 0.43 | ||||||||||||
| 30 x 50 | 0.25 | 0.32 | 0.38 | 0.44 | 0.51 | 0.57 | 0.64 | 0.70 | 0.76 | ||||||
| 40 x 40 | 0.18 | 0.24 | 0.30 | 0.36 | 0.42 | 0.48 | 0.54 | ||||||||
| 40 x 46 | 0.20 | 0.24 | 0.28 | 0.32 | 0.36 | 0.40 | 0.44 | 0.48 | 0.60 | 0.72 | 0.80 | ||||
| 50 x 60 | 0.19 | 0.22 | 0.26 | 0.29 | 0.32 | 0.35 | 0.39 | 0.48 | 0.58 | 0.64 | |||||
| 60 x 60 | 0.21 | 0.24 | 0.27 | 0.29 | 0.32 | 0.40 | 0.48 | 0.53 | 0.67 | ||||||
| 60 x 80 | 0.20 | 0.22 | 0.24 | 0.30 | 0.36 | 0.40 | 0.50 |
Finding Flow Rate
It is sometimes difficult to estimate flow rates for surface irrigation systems, but several methods are possible.
- Ditch or pipeline: Measure of low rates with one of the flow measuring devices described later in this publication.
- Furrow systems: Measure flow with one of the portable measuring devices available. Or catch the flow to a single furrow in a bucket of known capacity, and measure the time it takes to fill the bucket. If you know the total flow into a furrow system, you can divide this amount by the number of furrows to find the flow rate into each furrow.
- Siphon tubes: Look up the flow rate in a siphon tube head-discharge chart.
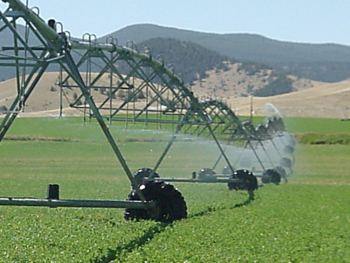
Photo: NCAT
To calculate flow rate for most sprinkler systems, you’ll need to know the average gpm per sprinkler. For center pivots, flow varies along the length of lateral pipe, and you’ll need to know the gpm for the entire pivot.
If your sprinkler system is relatively new and the nozzles have little wear, you can use the total design gpm of your system for a flow estimate. Be aware, however, that design numbers do not take into account increased flow (sometimes significant) due to nozzle wear and pressure variations. Divide the design gpm by the number of operating sprinklers on your sprinkler system to fi nd the average gpm per sprinkler. For pivots, use the design gpm for the entire pivot.
A more accurate way to fi nd the flow rate for your sprinkler system—especially if it’s an older system—is to conduct a simple bucket test. (See Appendix.)
Finding Irrigated Area
For most surface irrigation systems, the irrigated area is simply the entire area of the field. For furrow systems, you can use the length and spacing of the furrows to estimate irrigated area. (See example below.)
For most sprinkler systems, fi nd the area in square feet watered by one sprinkler, usually described as the distance, in feet, between sprinklers on the line multiplied by the distance, in feet, between mainline riser valves. Typical areas are 30 feet by 50 feet or 40 feet by 60 feet. (See Figure 1 for an example.) For pivots, use the entire swept area in acres and multiply by 43,560. (The conversion of acres to square feet.)
Calculating Net Water Application per Set
To calculate net water application in inches per set for any irrigation system, use the following general formula:
set time (hours) x flow rate (gpm) x 96.3 x system efficiency
irrigated area (sq. ft.)
Note 96.3 is a conversion factor.
Wheel line, hand line, end tow: Use the average flow rate (gpm) for one nozzle.
12-hour set, 8 gpm per sprinkler, 40′ x 60′ spacing, 65% system efficiency
12 x 8 x 96.3 x 0.66 = 2.5 inches net water
40x 60 application per set
Wild flood: Use total area flooded and total flow.
Example:
Seven 24-hour days, 800 gpm flow,
40-acre field, 20% system efficiency
7 x 24 x 800 x 96.3 x 0.20 = 1.5 inches net
40 x 43,560 water application
Center pivot system: Use the total pivot flow
Example:
50-hour rotation, 900 gpm, 130-acre field (=5,662,800 ft^2), 75% system efficiency
50 x 900 x 96.3 x 0.75 = 0.6 inches net water
5,662,800 application per set
Note: The wheel line example above was the flow for one nozzle divided by the area covered by one nozzle. The pivot formula uses the flow for the entire pivot divided by the area covered by the entire pivot. The result is the same – inches per set.
Graded furrows: Use furrow length and spacing.
Example:
11-hour set, 10 gpm flow per furrow, 660-foot-long x 3-foot-wide furrows, 50% system efficiency
11 x 10 x 96.3 x 0.50 = 2.7 inches net
3 x 660 water application
Stationary big gun sprinkler: Use flow per sprinkler.
Example:
10-hour set, 78 gpm, 120′ x 120′ spacing, 50% system efficiency
10 x 78 x 96.3 x 0.50 = 2.6 inches net water
120 x 120 application per set
Travelling big gun sprinkler: Use the following formula:
Net water = gpm x 1.6 x efficiency (%)
application S x W
where W = Width between travel lanes in feet, and S = travel speed in feet per minute (fpm)
Example:
300 feet between travel lanes, 0.4 fpm travel speed, 400 gpm, 60% system efficiency
400 x 1.6 x 0.6 = 3.2 inches net water application
0.4 x 300
Determining the Correct Set Time
Use the same basic formula above to determine how long it takes to apply a desired
amount of water by inserting the amount of water you want to apply for “net water application.”
For surface irrigation systems, it may be easier to use the following extremely handy formula:
Measuring Flows
You can measure f lowing water in an open channel or pipeline using one of the methods below. You can also measure water with a simple bucket test at the point where sprinklers apply it to the field (See Appendix).
Measuring Open Channel Flow
Open channel methods generally rely on a structure such as a weir, flume, or orifice installed in the channel. These structures typically include one or more staff gages
(also spelled gauges), installed either on the structure itself or in an adjacent stilling well, to determine water depth. (A staff gage is simply a vertical staff—resembling an ordinary yardstick—marked with numbers that indicate water depth.) Using a table for the specific size and type of structure, you look up the measured depth and convert it to a flow rate. More expensive, but more accurate, electronic measuring devices are now available to offer continuous flow measurement and recording.
Most open channel flow measuring devices work only under limited conditions. A structure suitable for a river or large canal will not be the best choice for a small ditch. Only a few of the more common methods to measure flows on smaller canals, ditches, and farm turnouts are considered here. A comprehensive guide is the U.S. Bureau of Reclamation’s Water Measurement Manual.
To ensure accuracy, the measuring site must meet a number of conditions:
- The ditch or canal must have a shallow grade with a relatively straight upstream segment and uniform cross-section, little turbulence, and quiet flow.
- Weirs require more slope than flumes or submerged orifices.
- The location must not cause sediment loading, debris buildup, or flooding of surrounding areas.
In selecting a water measurement structure, consider cost, accuracy, ease of measurement, construction and maintenance requirements, and state or local water laws and regulations.
Weirs are easy to construct, install, and use, but require enough ditch slope so that water can fall freely from the structure to the downstream water surface. In the case of rectangular and trapezoidal weirs, water flows through a sharp-edged rectangular or trapezoidal notch. In the case of v-notch weirs, water flows through a sharp-edged (usually) 90 degree-angled notch. This weir is especially good at handling a wide range of flows.
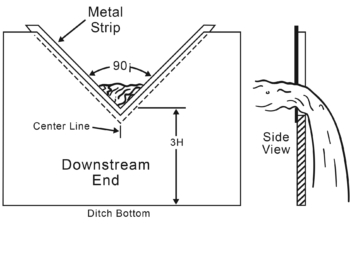
Figure 2. V-notch weir
Flumes are more complex structures than weirs, and include a constricted throat section that requires careful construction and installation. Flumes are used where ditch and canal grades are relatively flat. They can still be relatively accurate even when submerged.
Parshall flumes—one of the most common types—require only about a quarter of
the ditch grade needed for weirs and can accommodate a wide range of flows. Cutthroat flumes are a “throatless” variation on the Parshall flume, resulting in simplified construction.
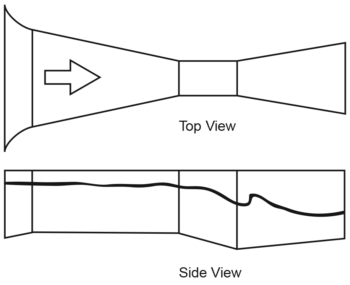
Figure 3. Parshall Flume
Submerged orifices are often used where ditch slope is insufficient for weirs. They generally cost less than weirs and can fit into limited spaces, but are susceptible to trash build-up. Water flowing through an orifice is discharged below the downstream water surface. For this device to be accurate, it must be submerged. The meter gate, a type of submerged orifice, can be used for farm turnouts. The gate can be used to measure flow, closed to shut off flow, or positioned at various settings to reduce or increase flow.
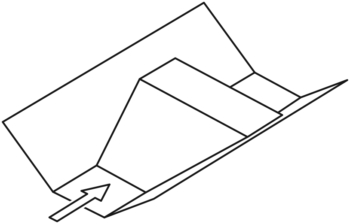
Figure 4. Ramp Flume
Choosing, installing, and using weirs, flumes, and submerged orifices is not difficult. In order to get accurate results, though, you need to install these devices properly, maintain them regularly, use proper measuring techniques, and use the right calibration curves and tables. Your local NRCS, Extension, or soil and water conservation district office may be able to assist you.
Measuring Pipeline Flow
Flow in a pipeline can be measured very accurately if the correct measuring device is installed and used properly. These devices need periodic calibration and maintenance, and water must be relatively (in some cases, very) clean. Accurate measurement requires full pipe flow.
Pipeline flow is measured by either intrusive devices (located inside the pipe or inserted through the pipe wall) or external devices. Intrusive flow meters include Venturi, nozzle, and orifice plate meters that measure flow through a constriction within the pipe. None have moving parts. They require little maintenance in clean water and are installed directly in the pipeline.
Propeller meters use a multi-blade propeller positioned inside the pipe. Propeller meters can pass some debris, but even moderate amounts can foul the blades.
Pitot tubes are inserted into the side of a pipe. They require drilling a hole through the pipe (allowing the insertion of the tube), making them less convenient and common than propeller meters.
Non-intrusive (external) flow meters send ultrasonic or acoustic waves through a pipe and take very accurate measurements of Doppler shift or transit time to calculate flow rate. These devices are clamped onto the outside of the pipe wall (nothing is physically inserted into the pipe) which makes them extremely quick and convenient to use. Several types of ultrasonic meters are currently on the market. They are costly, in the range of $1,500 to $10,000, although prices are dropping, and some training is required for accurate measurements.
Irrigating with Limited Water Supplies
When water supplies are short:
- Don’t over-irrigate. Learn the waterholding capacity of your soils, their allowable depletion, and the effective root depth and critical growth stages
of your crops. - Focus irrigation on critical growth stages. Depending on the crop, you’ll usually see one of two types of responses to drought stress:
- Seed crops, cereals, and oilseeds are most sensitive to drought stress during flowering or seed formation, and relatively insensitive during early vegetative growth. Irrigate enough at the onset of seed formation to carry the crop through seed fill.
- Perennial crops grown primarily for forage, and some root crops, are relatively insensitive to moderate drought stress for short periods throughout the growing season. They can recover from stress periods with little reduction in yield. Focus on irrigating during periods of maximum growth.
- Irrigate early in the season. Fill the root zone to field capacity before hot weather starts.
- Leave room in the soil for precipitation. Crop residue and cover crops help capture snow and rain and reduce evaporation.
- Aim for optimum rather than maximum yield (i.e., the greatest yield with the least input).
- Plant drought-tolerant crops or quick maturing crops that require most of their water early in the season.
- Reduce the amount of land you irrigate and use the saved water on the remainder, or reduce the amount of water you apply over the whole irrigated area.
- Irrigate every other furrow, switching at each irrigation. You’ll still get water to one side of each row, generally using far less water.
Further Resources
NCAT Resources
Drought Resistant Soil. 2002. By Preston Sullivan.
Explains how organic matter can dramatically increase the soil’s water storage capacity and how ground cover increases the water infiltration rate while lowering soil water evaporation. Both practices reduce the severity of drought and the need for irrigation.
Sustainable Irrigation: A Beginner’s Guide.
Aimed at beginning farmers with little or no experience, this course begins at square one and demystifies the irrigation process: providing a friendly introduction to equipment, terminology, and safety precautions. Unlike other irrigation courses that take a more industrial or engineering approach, this one maintains a strong focus on sustainability throughout.
Other Publications
Irrigation Water Measurement as a Management Tool. 2002. By Danny H. Rogers, Gary Clark, and Mahbub Alam. Kansas State University Agricultural Experiment Station and Cooperative Extension Service, Manhattan, KS.
Discusses tensiometer installation, use, and troubleshooting.
Selection and Use of Water Meters for Irrigation Water Measurement. 2003. By Melissa C. Baum, Michael D. Dukes, and Dorota Z. Haman. University of Florida, Institute of Food and Agricultural Sciences, Gainesville, FL.
Descriptions, use, maintenance, and comparison of various flow-measuring devices.
How Good Is Your Water Measurement? 1999. By Robert Hill. University of Utah Cooperative Extension Service.
Open channel and pipeline devices, typical prices, and sources of equipment.
Agencies
U.S. Bureau of Reclamation. 2001. Water Measurement Manual. U.S. Department of the Interior, Washington, DC. 317 p.
USDA-Natural Resources Conservation Service. 1997. NRCS Irrigation Guide. Natural Resources Conservation Service, Washington, DC. 702 p.
Appendix: Finding Flow Rate with a Bucket Test
For hand move, side roll, or linear move systems:
Measure the flow of one sprinkler per lateral, situated on relatively level ground. The selected sprinkler should be about one-third of the way down the length of the lateral from the mainline. Use a hose to direct the flow into a five-gallon bucket. Using a stopwatch, estimate the time it takes, in seconds, to fill the bucket. For greater accuracy, take more than one reading per sprinkler and average the times. Repeat for the other sprinklers on other laterals.
Number of seconds to fill bucket = _____ seconds
Avg gpm/sprinkler = 300 ÷ the number of seconds
300 ÷ ________ seconds = ______ gpm
Total flow per hand line or wheel line
= Avg gpm/sprinkler x # of sprinklers = ______ gpm
For pivots:
Step 1. Measure the flow of one sprinkler in each set of nozzle diameters along the pivot using the method described for hand move, side roll, or linear move systems above.
| Seconds to fill bucket | Average gpm/sprinkler | # of sprinklers in each set | Total gpm in each set |
|---|---|---|---|
| 300 ÷ ___ sec = | ____ gpm | x ___ = | ___gpm |
| 300 ÷ ___ sec = | ____ gpm | x ___ = | ___gpm |
| 300 ÷ ___ sec = | ____ gpm | x ___ = | ___gpm |
Total Flow = ____ gpm
Step 2. Estimate flow from the end gun using end gun pressure and nozzle diameter from the table below.
= _____________ gpm
| Diameter of | end gun | noxxle | (inches) | ||
| PSI | 1/2 | 3/4 | 1 | 1 1/2 | 2 |
| 10 | 23.6 | 53.2 | 94.4 | 212 | 378 |
| 20 | 33.4 | 75.3 | 134 | 300 | 534 |
| 30 | 40.9 | 92.2 | 164 | 368 | 654 |
| 40 | 47.2 | 106 | 189 | 425 | 755 |
| 50 | 52.8 | 119 | 211 | 485 | 845 |
Step 3. Add the results from Step 1 and Step 2 above to calculate total flow for pivot.
= __________ gpm
Measuring and Conserving Irrigation Water
By Mike Morris and Vicki Lynne, NCAT Energy Specialists
© 2006 NCAT
IP 280
This publication is produced by the National Center for Appropriate Technology through the ATTRA Sustainable Agriculture program, under a cooperative agreement with USDA Rural Development. ATTRA.NCAT.ORG